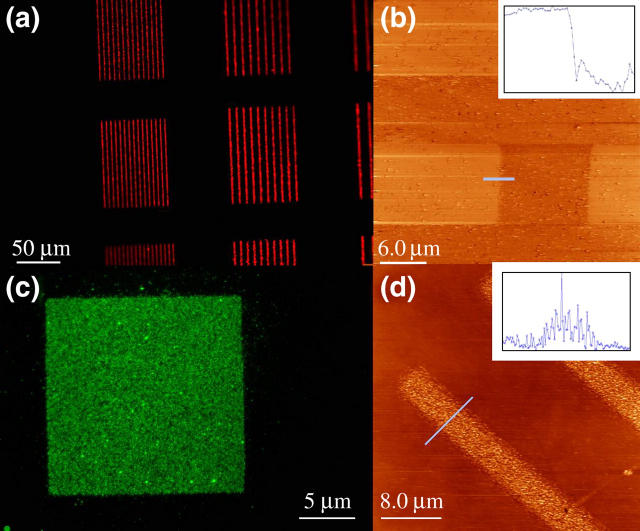
FIGURE 3.
Epifluorescence and TMAFM images were taken from two different incubation conditions for the lipid vesicles to assess SLB formation. (a and b) Images of an SLB formed by vesicles containing DSPC and gangliosides, incubated at 37°C. (Inset) Scan corresponding to blue line in picture. Mean height of bilayer above the substrate is ∼7 nm. (c and d) Images of adhered vesicles containing DSPC and gangliosides incubated at room temperature. Vesicles do not fuse completely to form a bilayer. (Inset) Scan corresponding to blue line in picture, maximum height 40 nm.

