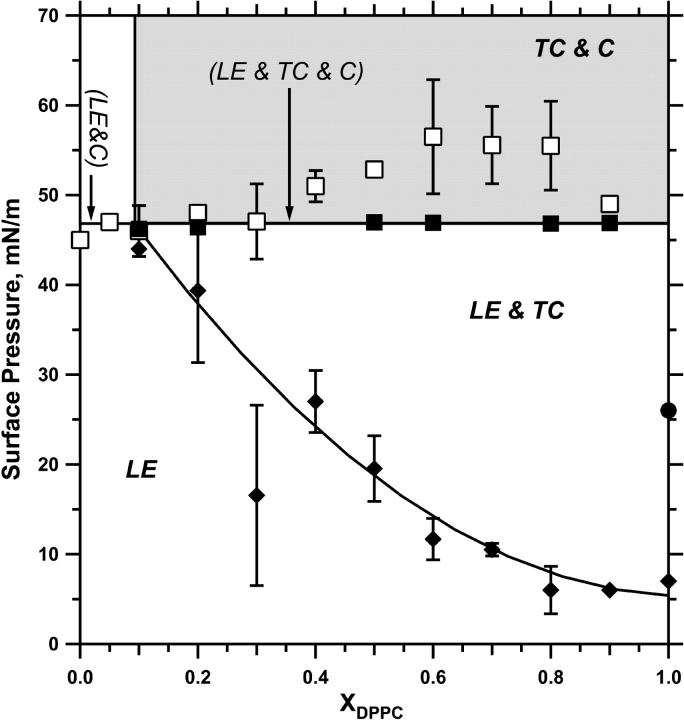
FIGURE 4.
Phase diagram for monolayers of DOPC/DPPC. For films with different XDPPC compressed on a Langmuir trough at a constant rate of 3 Å2/(molecule × min), (♦) indicate the π at which fluorescence microscopy first detected the nonfluorescent phase. The curved line through these points was drawn by hand. (□) show the π at which brightly fluorescent spots, consistent with collapsed structures, first appeared. (▪) indicate the π to which films relaxed on a captive bubble when held at constant area after compression to 52 mN/m. The horizontal line through these points represents the average π for the filled squares. The (•) indicates the only point at which microscopy indicated the completion of transition from the fluorescent phase to a homogeneously nonfluorescent film. Labels indicate conditions at which the LE, TC, and collapsed (C) phases are present. Labels in parentheses represent coexistence that occurs along the isobaric line indicated by the arrow. Labels in bold without parentheses represent the phases present in the region bounded by solid lines. The shaded zone indicates conditions at which the film is metastable rather than at true equilibrium. Data are mean ± SD for at least three measurements.

