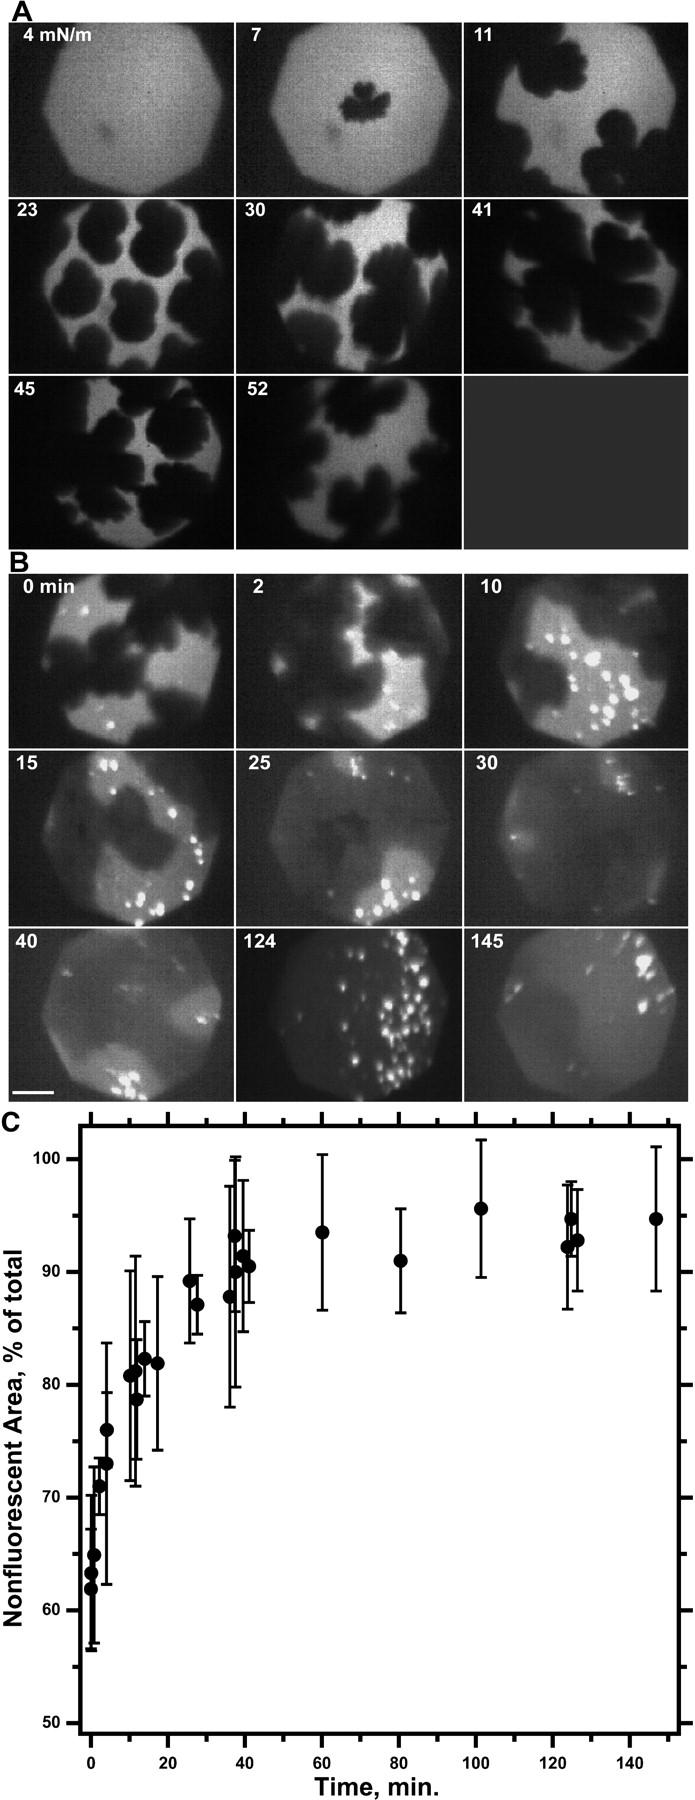
FIGURE 5.

Variation of coexisting phases during continuous and then isobaric compression of a DOPC-DPPC monolayer. Films containing DOPC-DPPC at XDPPC = 0.80 mixed with 0.5 mol % Rh-DPPE at 22°C were compressed continuously at 3 Å2/(molecule × min) to 52 mN/m and then isobarically using simple feedback to hold π constant. Images were recorded at regular intervals with the gain of the camera held constant and with the same magnification. Scale bar represents 50 μm. (A) Fluorescence micrographs during the initial compression at a constant rate from 0 to 52 mN/m. Labels indicate π (mN/m) at which the images were obtained. (B) Images during the isobaric compression at 52 mN/m. Labels indicate time (minutes) after reaching 52 mN/m. (C) Area of nonfluorescent domains during isobaric compression. Area is expressed as the fraction of total area, obtained by counting pixels with grayscale below a threshold value in images captured at a rate of 1 Hz. Data are mean ± SD from values boxcar-averaged over a series of successive images and representative of three experiments.
