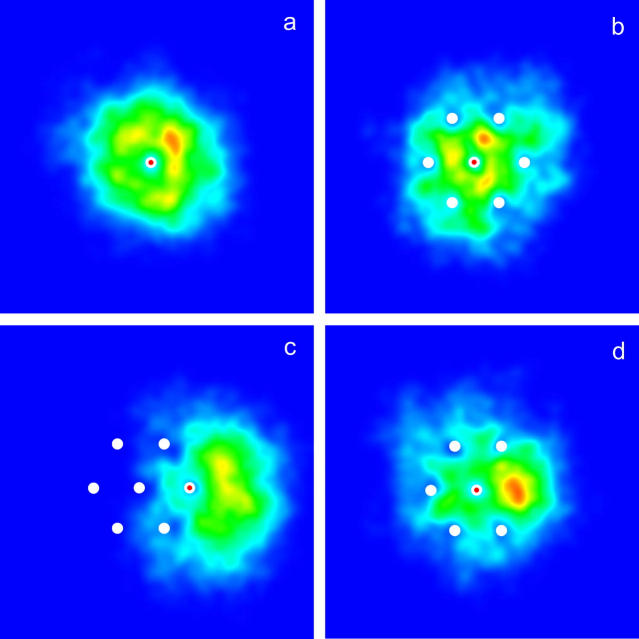
FIGURE 3.
Density plot of the end-to-end distance (h) of the contacts of the free end of the molecules with the grafted primers for various configurations. The red and white dot represents the molecule being followed, whereas the white dots represent other grafted molecules. In a, a single molecule is considered. As expected the distribution is symmetric around the grafted monomer. In b and c, the central molecule and one of the molecules on the perimeter of the small symmetric brush (see Fig. 2) are considered. The effect of the other molecules can clearly be seen. In the case of the molecules on the perimeter, their free ends are pushed outwards, away from the other molecules. In d, the central molecule of a small brush missing one perimeter molecule is considered. The free end of the central molecule tends to occupy the space left empty by the missing molecule.

