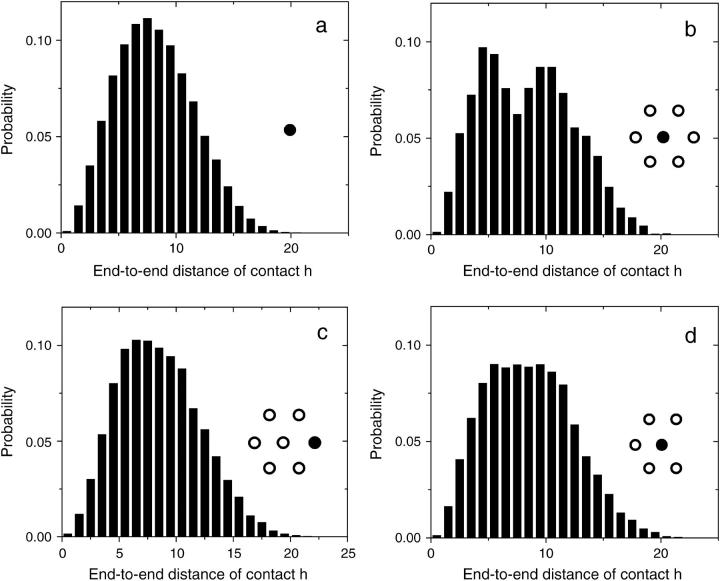
FIGURE 4.
Probability distribution function for the end-to-end distance of contacts (h), for the molecules shown in Fig. 3, and has solid circles in the insets. (a) A single isolated molecule. (b) The center molecule of a small symmetric colony shows a dip at the radius corresponding to the other molecules. The distributions for both a molecule from the perimeter of a small symmetric colony (c) and the central molecule of a small symmetric colony missing one molecule (d) are flattened in comparison with the distribution found for an isolated molecule. The average contact distance is similar for all configurations: (a) 〈h〉 = 8.2(1); (b) 〈h〉 = 8.4(2); (c) 〈h〉 = 8.5(2); and (d) 〈h〉 = 8.5(1).

