
FIGURE 3.
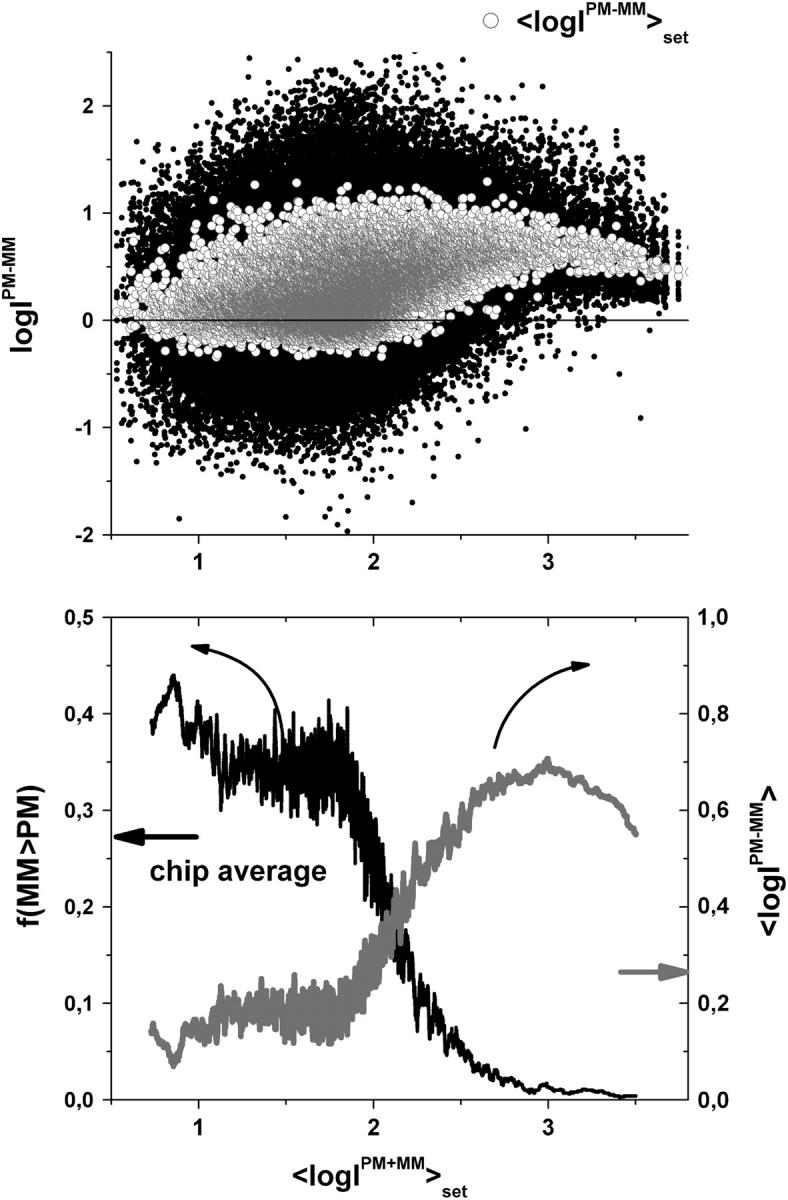
Log-intensity difference between PM and MM probes of the whole data set of ∼250,000 probes of an HG U133 chip (upper panel), fraction of bright MM (lower panel, left ordinate) and mean log-intensity difference (lower panel, right ordinate) as a function of the mean set averaged intensity. The fraction of bright MM and the mean difference were calculated as running averages over 1000 subsequent probes along the abscissa. Note the agreement with the respective data obtained from the spiked-in data set (Figs. 1 and 2). It shows that the dependence of the probe intensities on the concentration of specific transcripts applies to the whole set of probes of the chip.