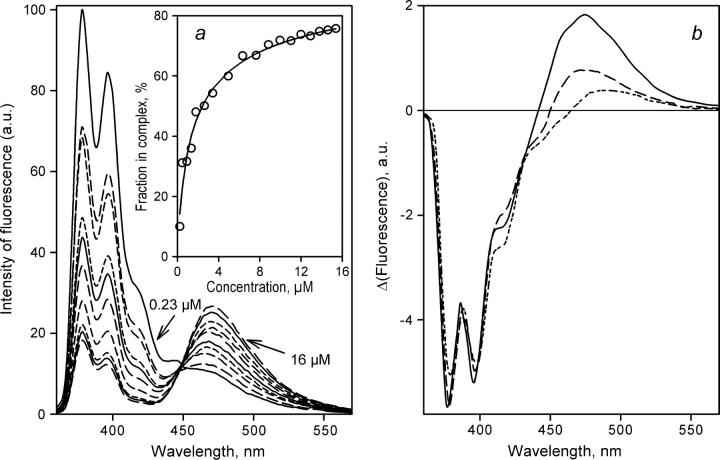
FIGURE 4.
Determination of KD of the complex of labeled P450eryF S93C/C154S with 1-PB bound at the high-affinity binding site by FRET in a dilution setup. (a) Normalized emission spectra of an equimolar mixture of P450eryF with 1-PB at 0.23, 0.9, 1.4, 2.6, 3.4, 4.9, 7.6, 11, 13, and 16 μM P450eryF-MDCC. Intensity of fluorescence is expressed in arbitrary units (a.u.). The inset shows the results of the same experiment as the plot of the amplitude of FRET given by the loading factor of the first principal component versus the concentration of P450eryF-MDCC. The solid line shows the approximation of this data set by Eq. 3 with KD = 1.2 μM. Conditions were as in Fig. 3. (b) The spectra of the first principal component derived from the experiments with equimolar mixtures of 1-PB with P450eryF-CPM (solid line), P450eryF-MDCC (long-dashed line), and P450eryF-bimane (short-dashed line).

