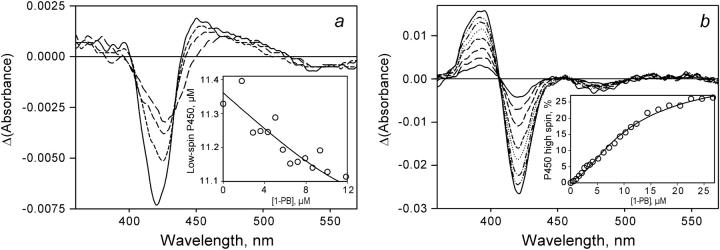
FIGURE 6.
Changes in the spectra of absorbance of P450eryF-MDCC upon its interactions of 1-PB. (a) A series of the difference spectra derived from the titration of 12.7 μM enzyme with 1-PB. The main panel shows the spectra obtained by subtraction of the spectrum of the substrate-free enzyme from the spectra measured at 2.9 (long-dashed line), 5.8 (medium-dashed line), 8.6 (short-dashed line), and 11 μM (solid line) 1-PB. This experiment was done in a cell with an optical path length of 5 mm. The inset shows the changes in the apparent concentration of the low-spin P450eryF derived from this experiment. The solid line represents the results of the fitting of this data set by Eq. 3 with KD = 0.9 μM. (b) A series of the difference spectra derived from the titration of 2.4 μM enzyme with 1-PB. The main panel shows the spectra obtained by subtraction of the spectrum of the substrate-free enzyme from the spectra measured at 2.6 (solid line), 5.1 (long-dashed line), 7.2 (medium-dashed line), 10 (short-dashed line), 12 (dotted line),14 (dash-dotted line), 18 (dash-double-dotted line), and 23 μM (solid line) 1-PB. The optical path length of the cell used in this experiment was equal to 10 mm. The inset shows the changes in the high-spin fraction of the enzyme derived from this experiment. The solid line represents the results of the fitting of this data set by Eq. 5 (see Discussion) with KD1 = 1.2 and KD2 = 8.5 μM.

