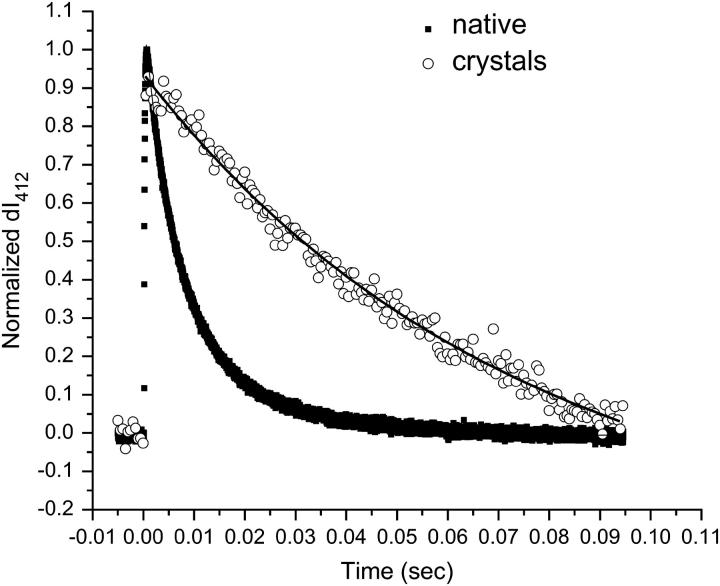
FIGURE 4.
Comparison of M decay kinetics in DDW, expressed as the intensity of the 412 nm absorption. The M decay for the native solution fits best to a biexponential expression with an average decay time of 10 ms, whereas that for the bicelle crystals fits best to a monoexponential expression with an average decay time of 73 ms—a decay time over seven times slower than observed in native bR.

