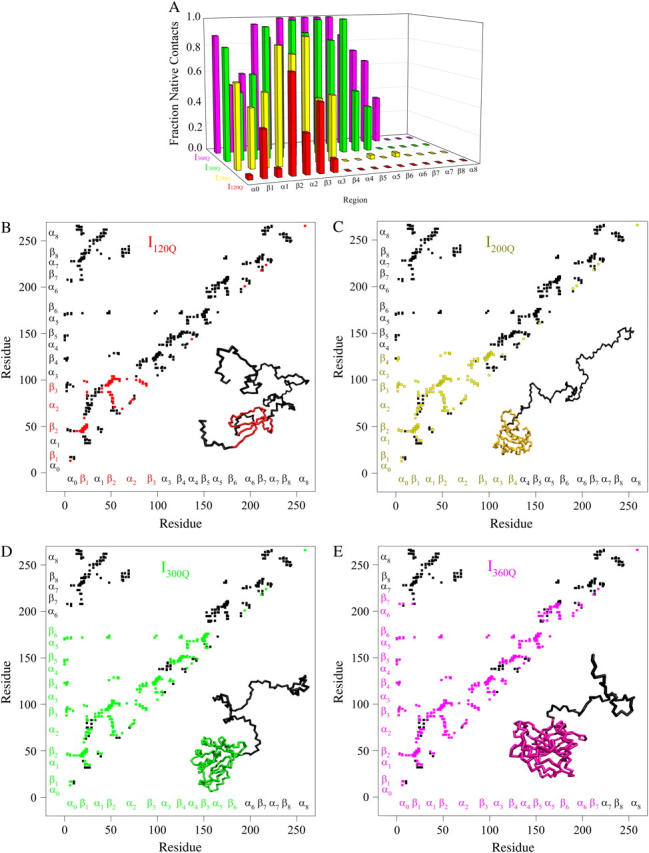
FIGURE 10.

Folded regions of αTS kinetic intermediates. (A) Fraction of native contacts formed with probability >0.5 for intermediates I120Q (red bars), I200Q (yellow bars), I300Q (green bars), and I360Q (magenta bars) in αTS kinetic folding simulations. (B) Contact map and representative MD structure for I120Q. Squares in the contact map indicating contacts populated >0.5 and regions in the I120Q structure with >0.2 fraction of native contacts folded are labeled in red. (C) Contact map and representative MD structure for I200Q. Squares in the contact map indicating contacts populated >0.5 and regions in the I200Q structure with >0.2 fraction of native contacts folded are labeled in yellow. (D) Contact map and representative MD structure for I300Q. Squares in the contact map indicating contacts populated >0.5 and regions in the I300Q structure with >0.2 fraction of native contacts folded are labeled in green. (E) Contact map and representative MD structure for I360Q. Squares in the contact map indicating contacts populated >0.5 and regions in the I360Q structure with >0.2 fraction of native contacts folded are labeled in magenta. In Fig. 5, B–E, squares in the contact maps indicating contacts populated <0.5 and regions of each MD structure with <0.2 fraction of native contacts folded are labeled in black. In Fig. 5, B–E, secondary structure elements of αTS are shown along each axis for reference with folded I120Q regions colored in red (Fig. 5 B), folded I200Q regions colored in yellow (Fig. 5 C), folded I300Q regions colored in green (Fig. 5 D), folded I360Q regions colored in magenta (Fig. 5 E), and unfolded regions colored in black.
