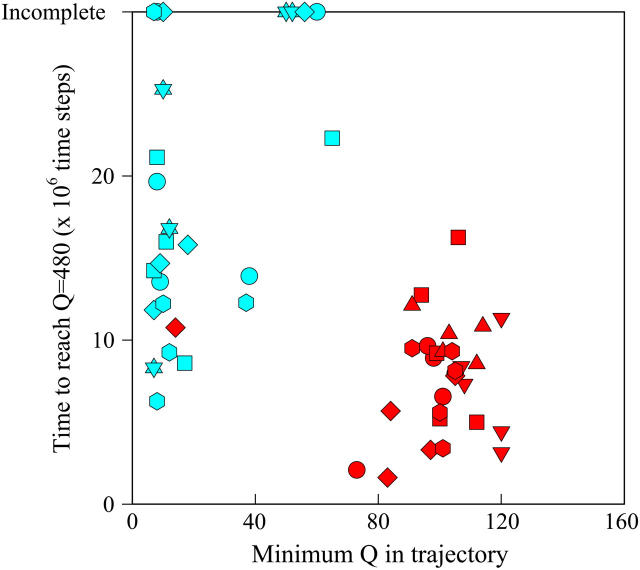
FIGURE 12.
Time steps to reach native ensemble (Q = 480) and minimum value of Q sampled during simulations initiating with Q = 120 structures from  (red symbols) and
  (blue symbols) ensembles. Five different initial
  configurations were obtained from trajectories 6 (circles), 34 (squares), 45 (triangles), 47 (inverted triangles), 57 (diamonds), and 59 (hexagons). Five different initial
  configurations were obtained from trajectories 7 (circles), 35 (squares), 46 (triangles), 48 (inverted triangles), 58 (diamonds), and 60 (hexagons).

