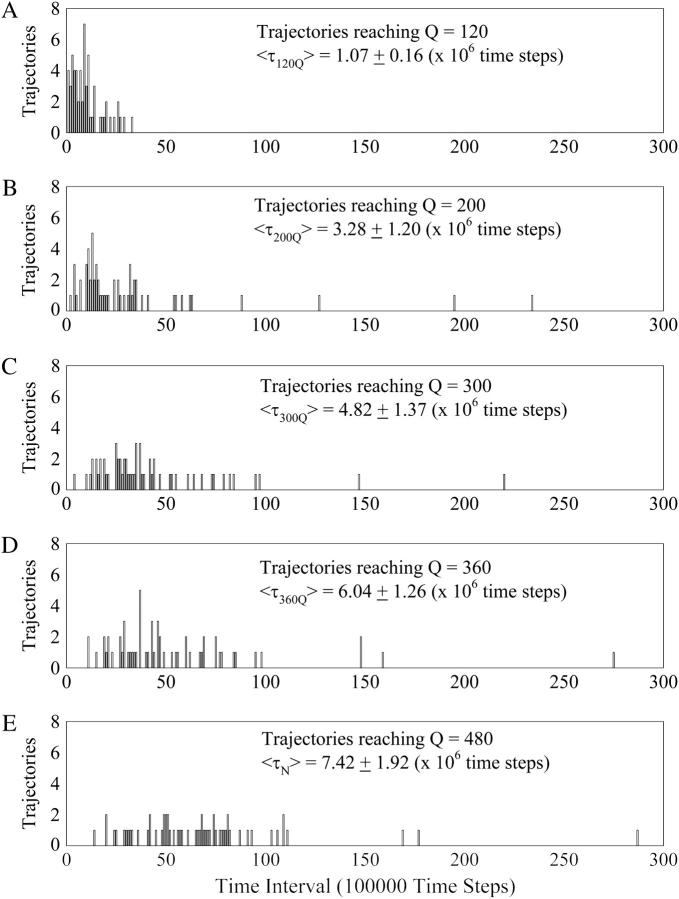
FIGURE 8.
The initial 3 × 10⁷ time steps of the kinetic trajectories are segregated into a histogram of 300 time intervals of 100,000 time steps. In Fig. 8, A–E, each of the 60 trajectories is “counted” in a time interval bin when it reaches Q = 120 (A), Q = 200 (B), Q = 300 (C), Q = 360 (D), and Q = 480 (E) native contacts, producing a histogram of folding times. To determine the folding time, the average folding time of trajectories 1–20, 21–40, and 41–60 were calculated separately. The global average, 〈τ〉, and standard deviation of the average folding time to reach each Q value is shown in Fig. 8, A–E (see Materials and Methods).

