
FIGURE 9.
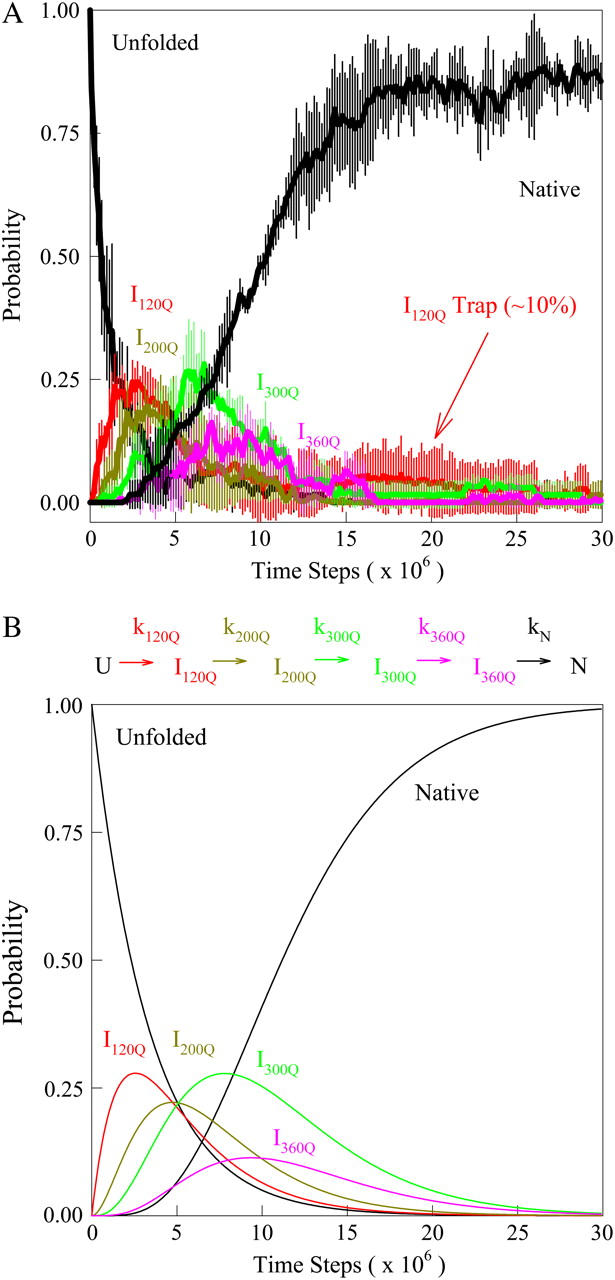
(A) The probability of populating unfolded, intermediate, and native ensembles at each time point during the simulation. Using the range of Q defined for each ensemble shown in Fig. 7, the probability of populating each ensemble is labeled and color coded for unfolded U (black), intermediate I120Q (red), intermediate I200Q (yellow), intermediate I300Q (green), intermediate I360Q (magenta), and native N (black). A long-lived trapped set of conformations in the I120Q intermediate at long times is indicated with the red arrow labeled “I120Q trap”. The probability was calculated separately for trajectory groups 1–20, 21–40, and 41–60. The global probability and standard deviation of the three separate probability calculations is shown with error bars at each time point (see Materials and Methods). (B) The populations of unfolded, intermediate, and native ensembles shown in Fig. 9 A are approximated using a  kinetic model with irreversible rate constants k120Q = 3 × 10⁻⁷, k200Q = 5 × 10⁻⁷, k300Q = 5 × 10⁻⁷, k360Q = 3 × 10⁻⁷, and kN = 7 × 10⁻⁷. Probabilities of each species are labeled and color coded as in Fig. 9 A, i.e., unfolded U (black line), intermediate I120Q (red), intermediate I200Q (yellow), intermediate I300Q (green), intermediate I360Q (magenta), and native N (black).