FIGURE 4.
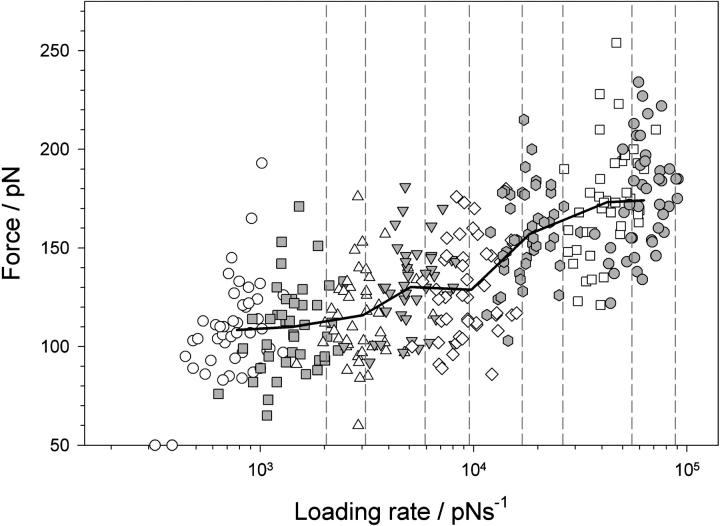
Loading rate dependence of the unfolding force of (protein L)5. The force at which a domain unfolds is plotted against the instantaneous loading rate at the unfolding point for each domain. Symbols show that the instantaneous loading rate differs significantly for domains extended at the same extension rate (open circles, 40 nm s−1; shaded squares, 77 nm s−1; open triangles, 140 nm s−1; shaded upside-down triangles, 230 nm s−1; open diamonds, 400 nm s−1; shaded hexagons, 700 nm s−1; open squares, 1400 nm s−1; and shaded circles, 2100 nm s−1). Solid black line joins points averaged in force and loading rate for each pulling speed. The apparent loading rate (dashed lines), calculated by multiplying the cantilever spring constant by the extension rate (40, 77, 140, 230, 400, 700, 1400, and 2100 nm s−1) and measured loading rate for each retraction speed differ significantly since the protein polymer is more compliant than the cantilever.

