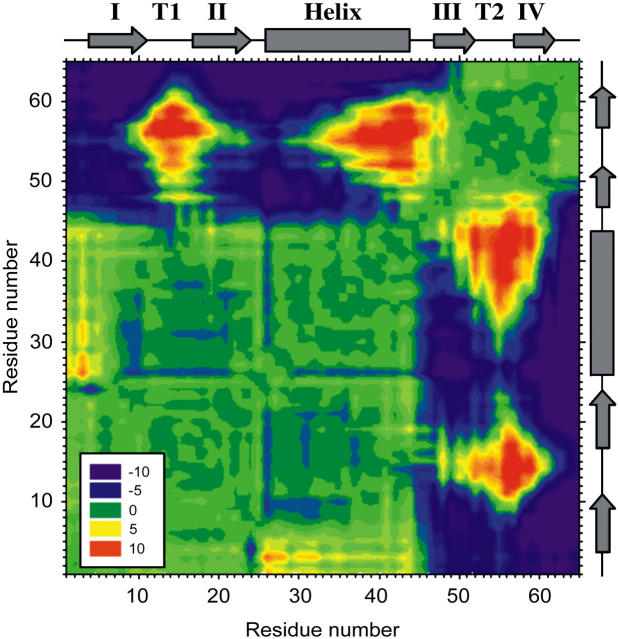
FIGURE 7.
Contour plot showing the difference in distance between every pair of amino acids in protein L at a total extension (protein and cantilever) of 1.6 Å before and 1.6 Å after the mechanical unfolding event. Residue numbers (left-hand side and bottom) are shown opposite cartoons (right-hand side and top) depicting the type of secondary-structure element that each residue occupies in the native state (rectangle, α-helix; arrow, β-strand). Strands are labeled I–IV and turn 1 and turn 2 are shown as T1 and T2, respectively. Pairs of residues that move farther apart from each other during unfolding are colored purple to green (−10 to 0 Å); those that become closer to one another are shown green to red (0 to 10 Å).

