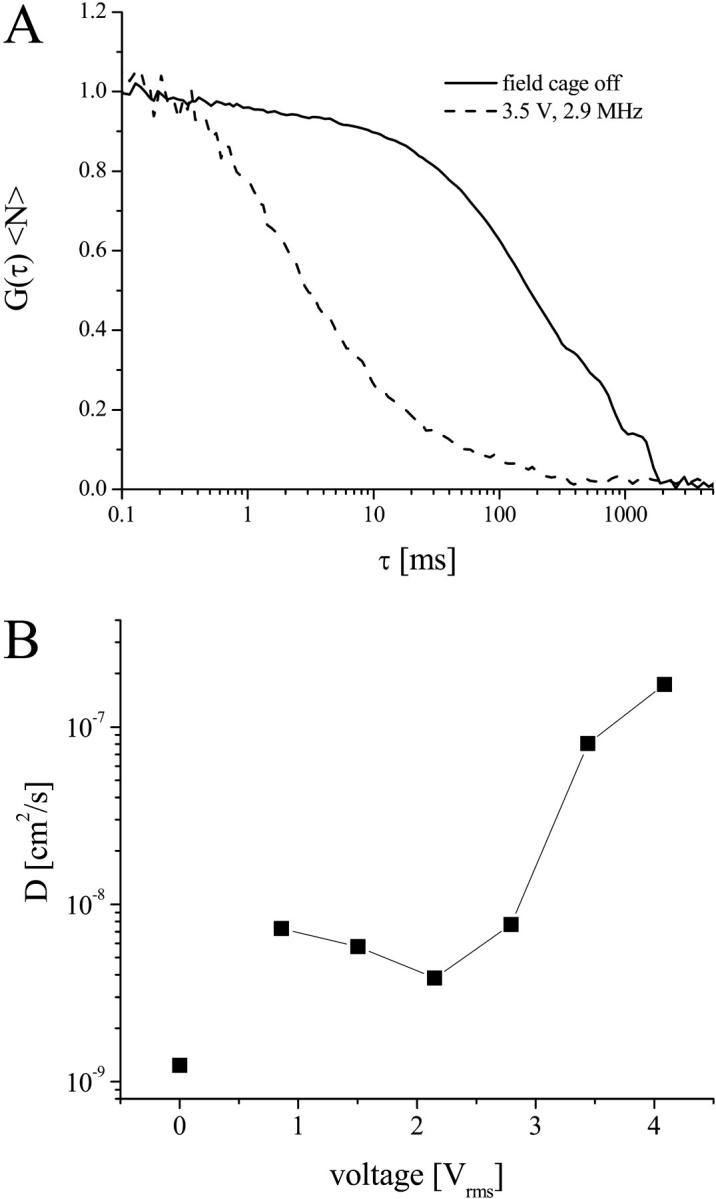
FIGURE 5.

FCS on GUVs trapped in octode field cages. (A) FCS curves of diI-C20:0 in the absence (solid line) and presence (dashed line) of an electric field in the cage (3.5 Vrms, 2.9 MHz, ac-mode). (B) Diffusion coefficients as a function of electric field, determined from fits to FCS curves as shown in A to a model of two-dimensional translational diffusion. The 0 V data point was measured on the GUV after it had settled to the bottom wall of the chamber. The error on the determined diffusion coefficients was ∼20%.
