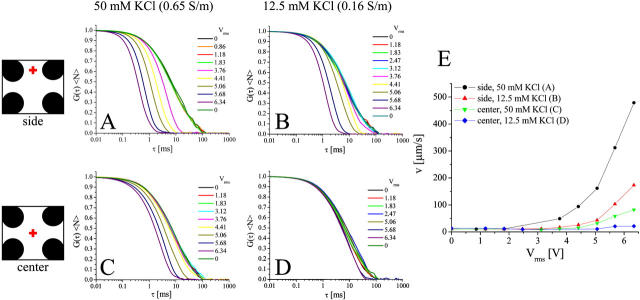
FIGURE 6.
Hydrodynamic streaming as a function of electric field inside the octode cage, measured by FCS of 100-nm latex beads. The relative position of the focal volume with respect to the electrodes is indicated schematically: between the upper electrodes for A and B, cage center for C and D. The concentration of KCl was 50 mM (0.65 S/m) in A and C, and 12.5 mM (0.16 S/m) in B and D. In all cases, the frequency was 0.75 MHz, ac-mode. E shows fluid velocities determined from fitting the FCS curves for the four conditions.

