
FIGURE 5.
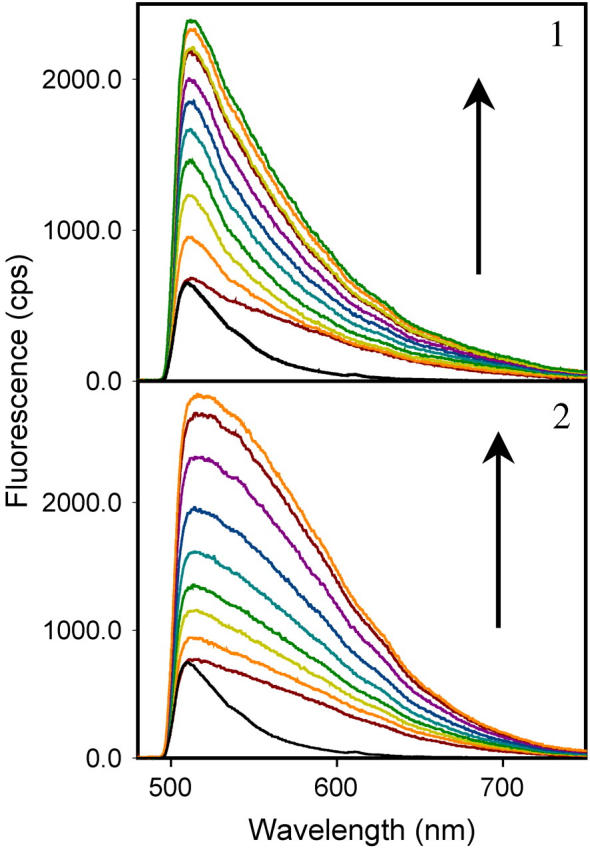
Bulk emission spectra of the amyloid fibrils stained with hybrid nanoclusters. The emission spectra of fibrils stained with the hybrid nanoclusters generated in ThT (10 μM)/AgNO3 (0.1 μM; colored lines, panel 1) and ThT (10 μM)/AgNO3 (1 μM; colored lines, panel 2). Hybrid nanoclusters display time-dependent increase of emission intensity during the first 10 min of observation as shown by arrows (from the bottommost spectra to the topmost spectra). Bulk emission spectra of fibrils stained with ThT alone are shown for comparison (black lines); ThT spectra were normalized relative to the bottommost spectrum of hybrid nanoclusters. All spectra were recorded upon excitation at 475 nm (irradiance 500 W/cm2) using a 510 nm long-path filter.