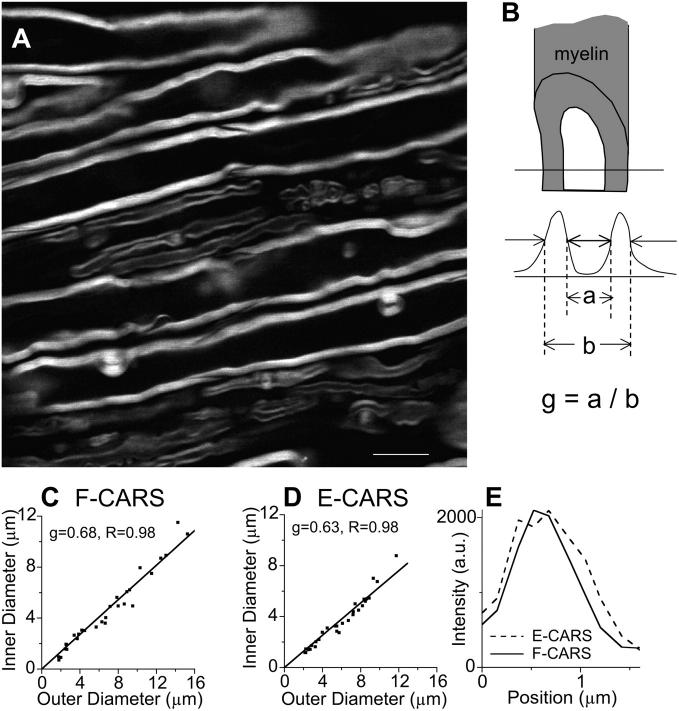
FIGURE 6.
(A) F-CARS image of axonal myelins with different thickness.  was tuned to 2840 cm−1. Bar = 10 μm. (B) Diagram of measuring the g ratio from CARS images. (C) The g ratio measured with F-CARS images. (D) The g ratio measured with E-CARS images. (E) An example of the E-CARS and F-CARS intensity profiles across a single myelin.

