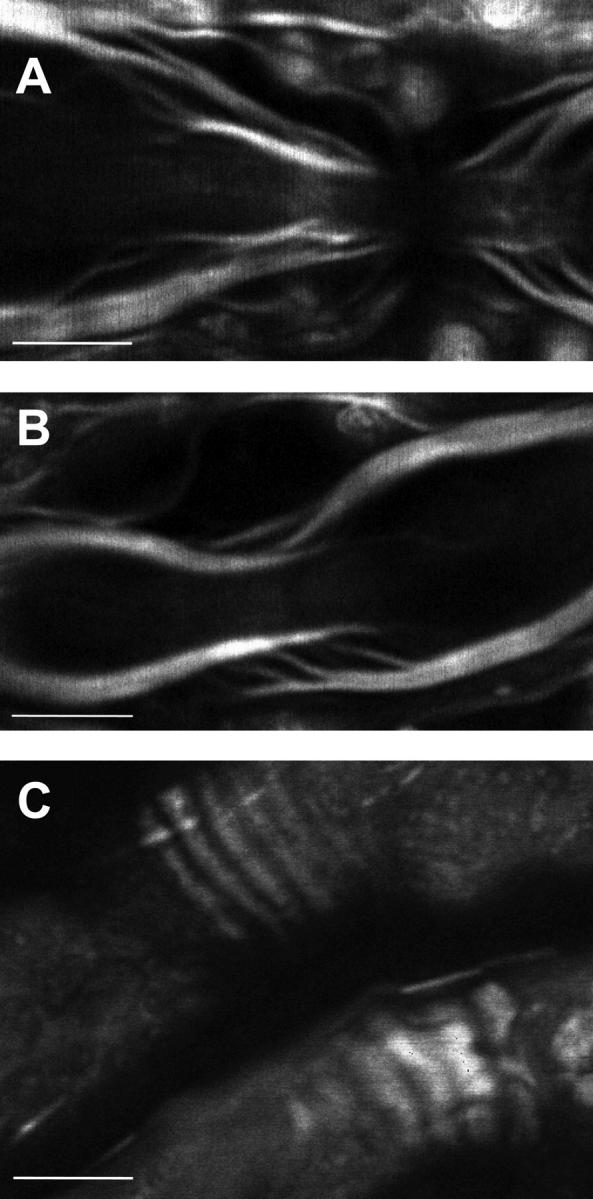
FIGURE 7.

Characteristic structures in single live axons visualized by CARS microscopy.  was tuned to 2840 cm−1. (A) F-CARS image of the node of Ranvier; (B) F-CARS image of Schmidt-Lanterman incisure; (C) E-CARS image of the incisure gap junction locating sites. Bar = 5 μm.
