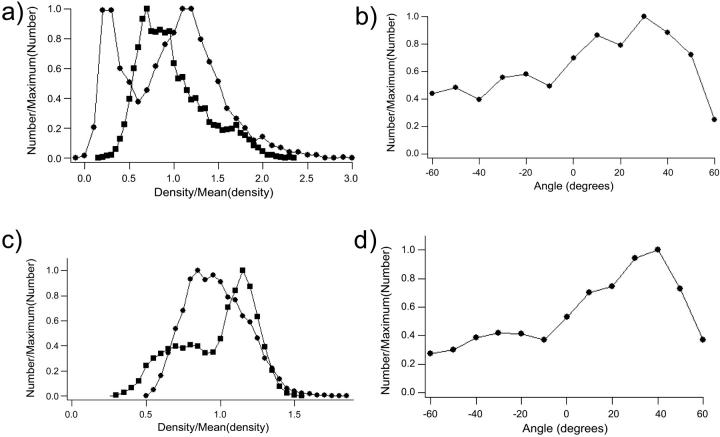
FIGURE 10.
(a) Row (•) and column (▪) density distributions for the 1.5-mg/ml remodeled matrix shown in Fig. 9 b. (b) Angular distribution from −60° to 60° for the 1.5-mg/ml remodeled matrix shown in Fig. 9 b. (c) Row- (•) and column (▪)-density distributions for the 1.5-mg/ml matrix shown in Fig. 9 c. (d) Angular distribution from −60° to 60° for the 1.5-mg/ml remodeled matrix shown in Fig. 9 c.

