FIGURE 3.

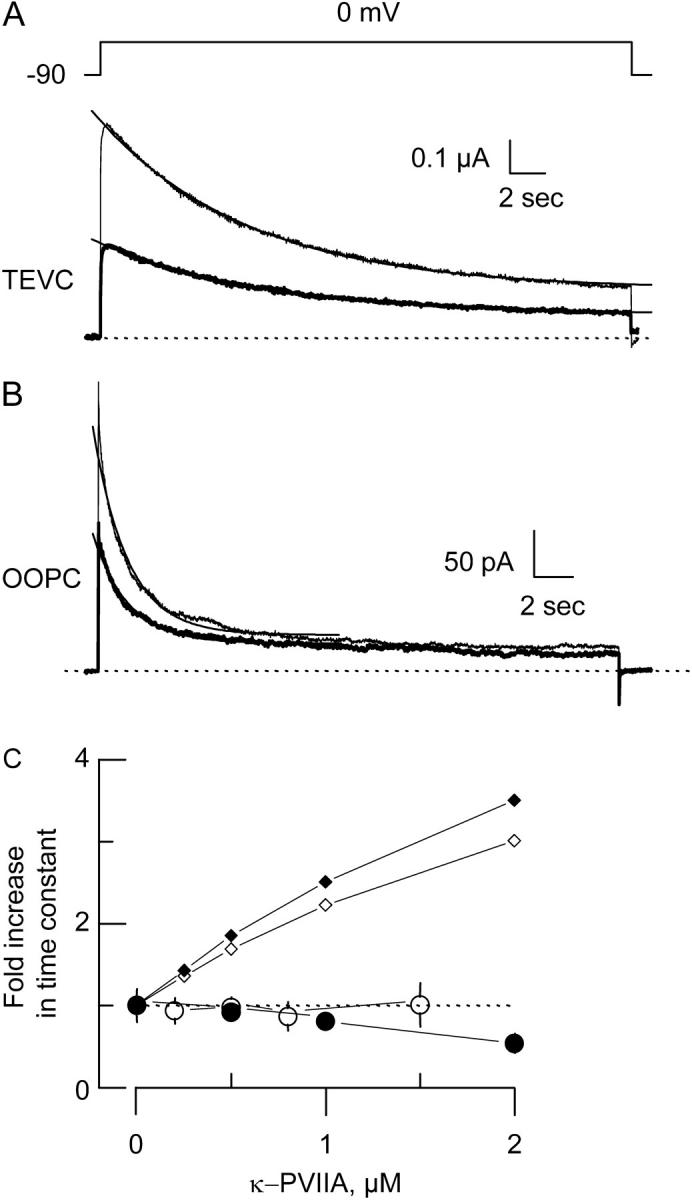
κ−PVIIA does not alter slow inactivation kinetics. (A and B) TEVC (A) and OOPC (B) current traces in the absence (thin lines) and in the presence (thick lines) of 0.5 μM κ−PVIIA elicited by ∼15 s pulses to 0 mV from a holding voltage of −90 mV. Each trace corresponds to an average of 6–10 individual traces. Single exponential fits drawn on top of the experimental traces were extrapolated to the beginning of the pulse. For TEVC traces, the time constants were 4.3 s and 4.7 s for control and toxin traces, respectively, whereas for OOPC they were 0.88 s and 0.9 s for control and toxin traces, respectively. For curve fitting details, see legend to Table 1. Traces were leak subtracted, and dotted lines correspond to the zero current level. (C) Normalized changes in the time constant of slow inactivation. Open and solid circles correspond to the averages of experimental values from 4 to 10 different patches or oocytes. Open and solid small diamonds are the expected time constant changes from Scheme 1, in which toxin is unable to bind to the inactivated state for TEVC and OOPC, respectively. For TEVC, this expectancy was obtained by assuming that in Scheme 1 the complex I·T has a very low probability of existence by multiplying koni and kib by 10−4 and koffi and krb by 104, respectively. For OOPC, kr = 0.076 s−1 and ki = 0.62 s−1, whereas krb=104·kr and kib=10−4·ki, and koni= 10−4·kono.
