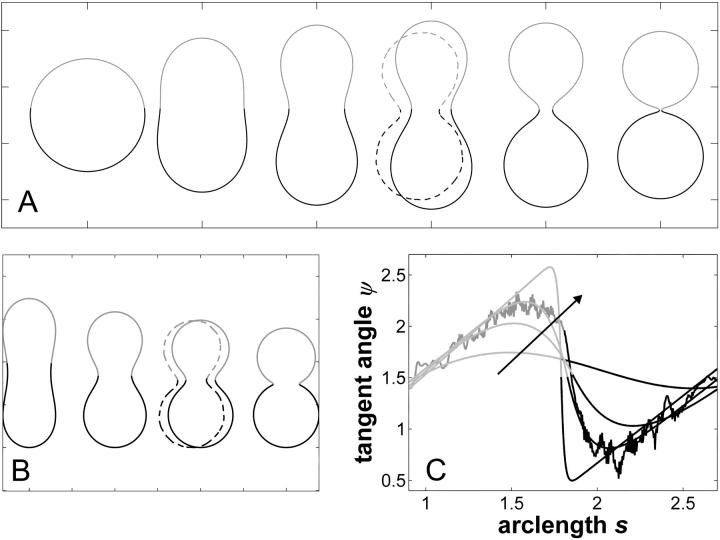
FIGURE 4.
Simulated vesicles with varying line tension but equal curvature moduli of Ld and Lo phases (ɛ = 1 and  ), area fraction equal to experimental shape. (Gray, Lo phase; black, Ld phase.) (A) Freely adjustable volume (pressure difference
  ), from left to right: dimensionless line tension
  4.2, 4.52, 4.382 (rb equal to experimental vesicle, which is shown for comparison with dashed lines), 4.46, and 5.2. (B and C) Vesicle shapes (B) and tangent angles near right phase boundary (C), for vesicles with volume fixed to experimental shape. From left to right (B) and in direction of arrows (C):
  (rb equal to experimental vesicle, which is shown for comparison with dashed lines, B; and as additional plot in C);

