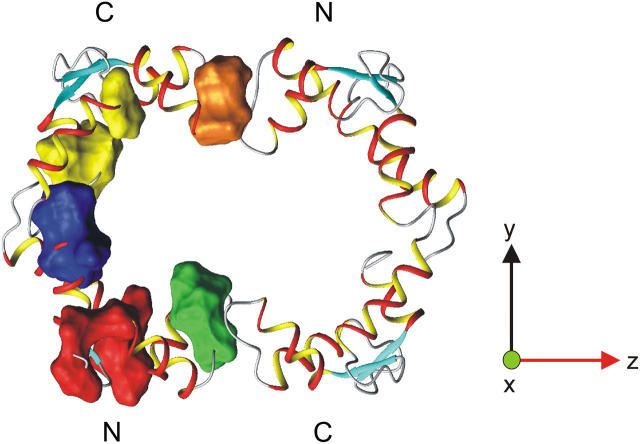
FIGURE 8.
Model of the CaM dimer. Different regions with significant conformational exchange (Table 1) are shown as surface representations in the left CaM molecule. The regions are localized in the vicinity of the N- and C-terminal hydrophobic pockets (red and yellow areas, respectively), in the dimerization interface of the N- and C-terminal regions (green and orange areas, respectively), and in the central helix (blue area). Residues 14 and 118 are excluded because they do not group into the above-defined clusters. The model of the CaM dimer is based on the CaM:SMLCK complex (9) where the N- and C-terminal domains of CaM have been rotated in such a way that the derived helical angles (vide supra) relative to the long axis of the diffusion tensor (z axis) are roughly in the correct orientation.

