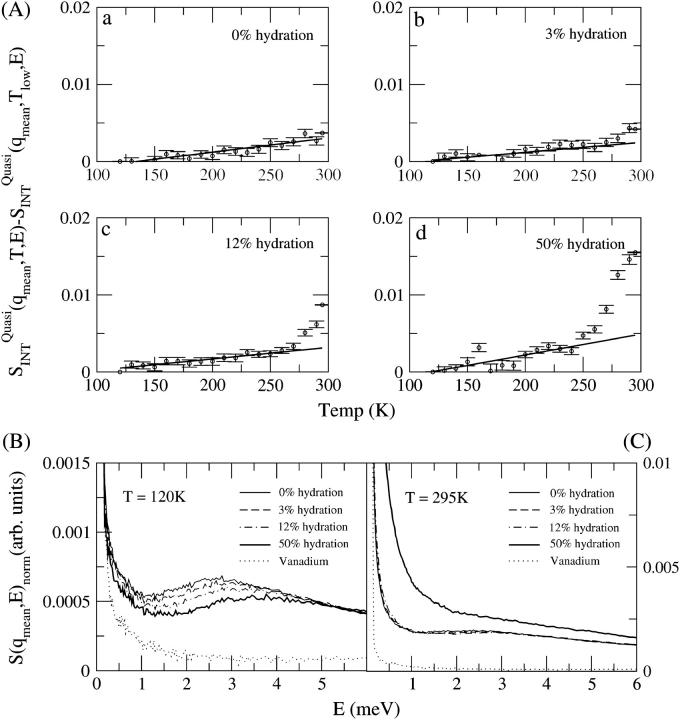
FIGURE 3.
(A)  a measure of quasielastic scattering as functions of temperature and hydration for (a) 0%, (b) 3%, (c) 12%, and (d) 50% hydration. (B) The dynamic structure factor S(q, E) at different levels of hydration at 120 K. (C) The dynamic structure factor S(q, E) at different levels of hydration at 295 K. Height of the spectra in B and C were normalized to 1 for zero energy transfer to visualize the variation in shape of the quasielastic intensity.

