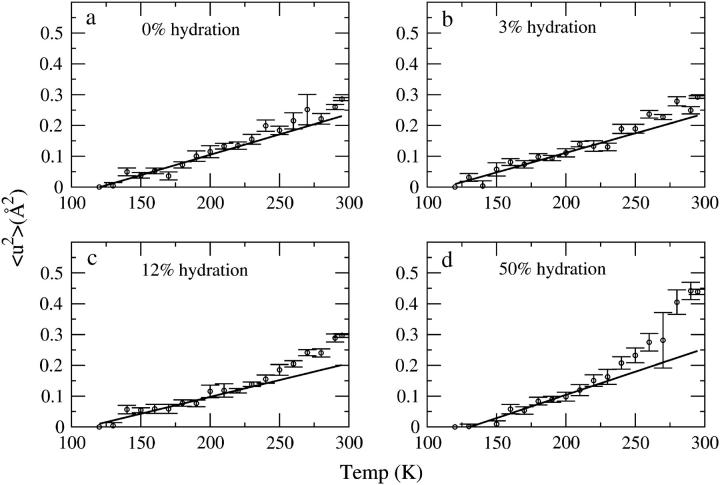
FIGURE 4.
〈u2〉 as a function of temperature for (a) 0%, (b) 3%, (c) 12%, and (d) 50% hydration. The 〈u2〉 values are normalized to the lowest temperature (120 K) at which measurements were made. The 〈u2〉 obtained by integrating the elastic intensity exhibited closely similar behavior as a function of temperature and hence is not shown here.

