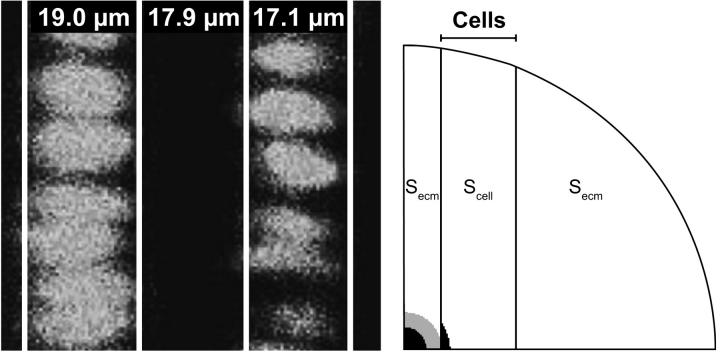
FIGURE 2.
(Left) Columns of cells in the proliferation zone of a porcine growth plate with their widths. (Right) Mesh with cell columns. For symmetry reasons, the displayed quarter is used during the theoretical validation. In simulations of experimental data, the complete mesh is used. The bleached area equals the gray ring together with the encapsulated black area. Secm and Scell denote the initial intensities in the areas outside the imaged area. The intensity recovery curves of the two black areas are used in the fitting algorithm.

