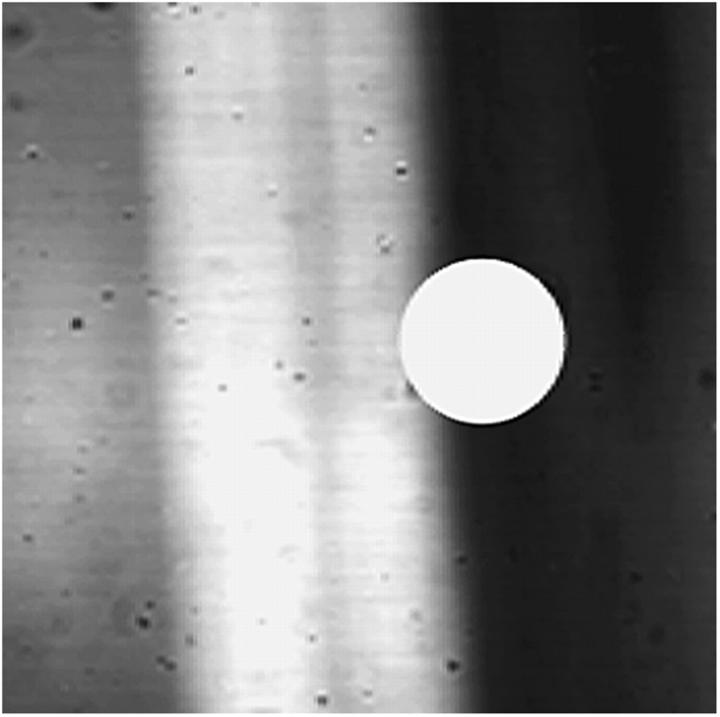
FIGURE 3.
Transition zone between the 3% and 8% agarose zones in the gel with both components is clearly visible with transmitted light (20× objective). (Left gray area) 3% agarose; (right black area) 8% agarose; (white band) projection of transition zone. The approximate size of the bleach spot is indicated in the figure as a white dot.

