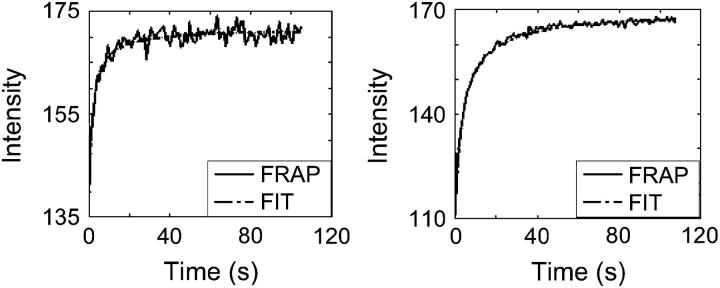
FIGURE 4.
Examples of recovery curves of FRAP measurements with (left) small and (right) large bleached areas in agarose. The fitted curves are plotted over the experimental curves. Although the curves are different, the obtained D is similar for these measurements (Table 2).

