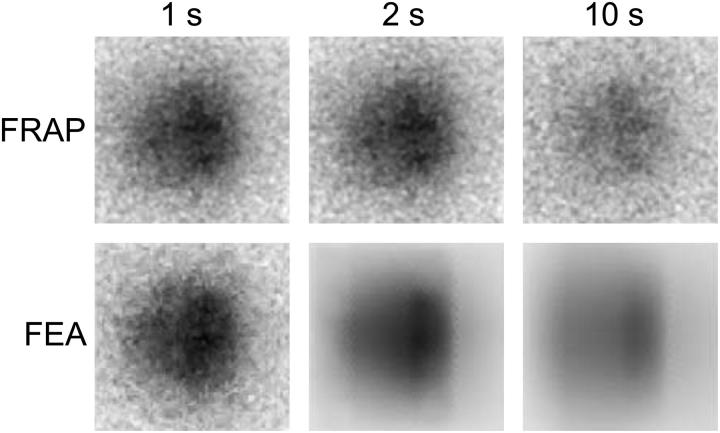
FIGURE 6.
(Top row) Measured intensity distribution at t = 1, t = 2, and t = 10 s after photobleaching in the growth plate. The t = 1 image is the first postbleach image, which is copied to the FE mesh (bottom left image). In the course of the simulation (bottom row), the noise disappears. The images in columns 2 and 3 are the results after fitting the data of this experiment. Associated fitted curves are shown in Fig. 5.

