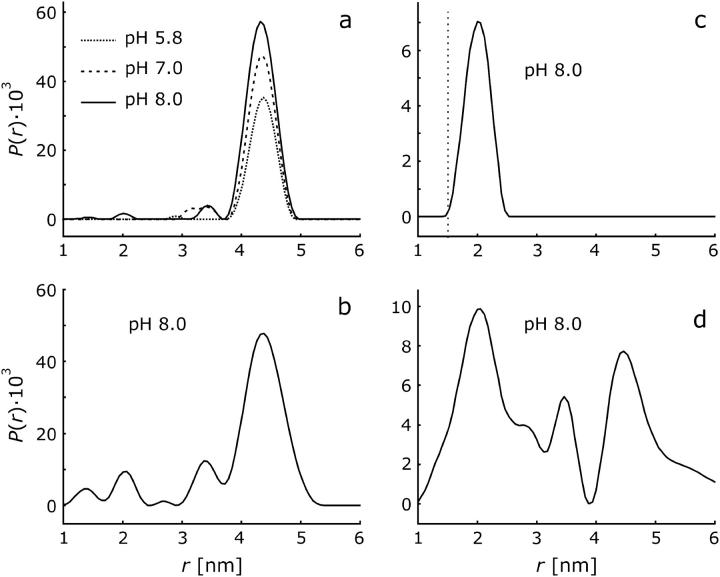
FIGURE 5.
DEER distance distributions P(r) obtained from the time-domain data in Fig. 4 by Tikhonov regularization in the range from 1 to 8 nm with a regularization parameter of 100. (a) H225R1 with planar background correction. (b) H225R1 with spatial background correction. (c) V254R1 with planar background correction. The dotted line marks the lower limit of distances that are detectable by DEER with our setup. (d) V254R1 with spatial background correction.

