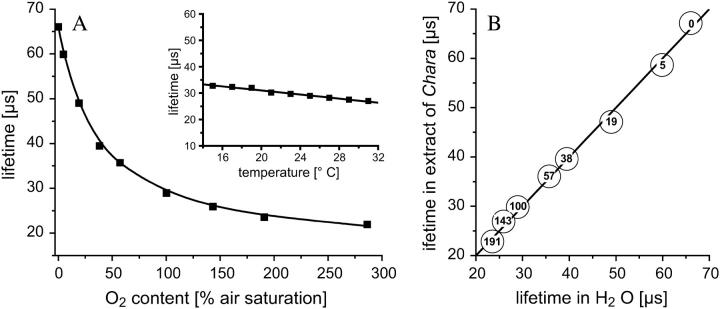
FIGURE 4.
(A) Correlation of sensor phosphorescence lifetime and oxygen content. Albumin-preincubated PtPFPP microbeads were suspended in desalted water at 23°C and aerated with various oxygen concentrations. The plotted lifetimes are average values of four single measurements. The reproducibility of a single measurement was in the range of ±1 μs. The adapted Stern-Volmer equation Eq. 1 was fitted to the data for x = 0.75 (black line). The inset shows the temperature dependency of the sensor's phosphorescence lifetime determined at 100% air saturation oxygen content. (B) Measurements in Chara corallina cell sap yielded the same lifetimes as in desalted water. The number within the circles show the corresponding oxygen content (% air saturation) at which the phosphorescence lifetime was determined.

