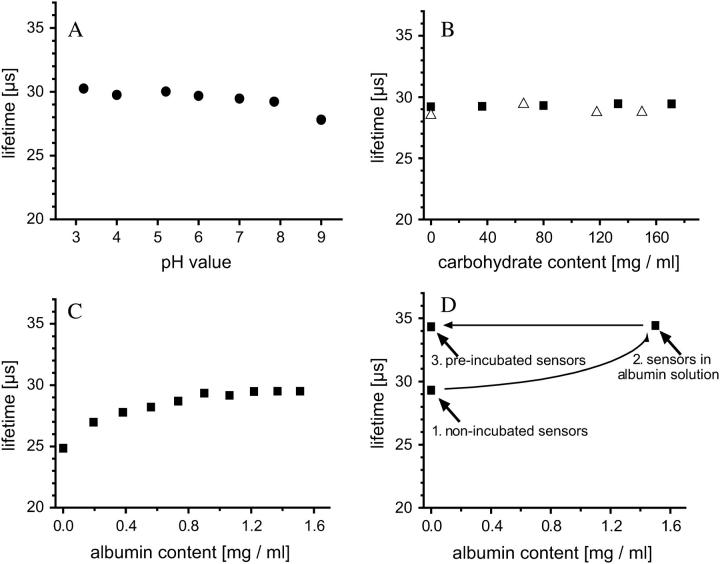
FIGURE 5.
(A) Shows the phosphorescence lifetimes of the oxygen sensor at different pH values, determined at 100% oxygen air saturation, and 24°C. (B) Effect of carbohydrates, determined at 100% oxygen. Sucrose at 23°C (squares), glucose at 25°C (triangles). (C) Effect of protein concentration, determined at 100% oxygen air saturation and 24°C. (D) Illustration of the irreversibility of protein adsorption onto the microbeads. First, phosphorescence lifetime was measured using microbeads that were not pretreated with a protein incubation (1). When these microbeads were then used to measure τ in a 1.5 mg ml−1 albumin solution with the same oxygen concentration as before, the phosphorescence lifetime increased (2). Once the beads were incubated in a protein solution, the phosphorescence lifetime of the beads became independent of the protein concentration of the solution (3). Measurements were done at 57% oxygen air saturation and 24°C.

