

Abstract
This report covers the two-photon activation and excitation properties of the PA-GFP, a photoactivatable variant of the Aequorea victoria green fluorescent protein in the spectral region from 720 to 920 nm. It is known from this special form of the molecule that it has an increased level of fluorescence emission when excited at 488 nm after irradiation at λ ∼ 413 nm, under single-photon excitation conditions. Here, we show that upon two-photon irradiation, PA-GFP yields activation in the spectral region from 720 to 840 nm. After photoactivation, the excitation spectrum shifts maintaining the very same emission spectrum of the single-photon case for the native and photoactivated protein. Additionally, when comparing the conventional photoactivation at λ = 405 nm with a two-photon one, a sharper and better controllable three-dimensional volume of activation is obtained.
INTRODUCTION
The use of green fluorescent protein (GFP) (1,2) from Aqueorea victoria has increased dramatically over the years thanks to the potential to explore the protein distribution in living cells (3). Besides imaging for protein localization, fluorescence recovery after photobleaching techniques are largely employed today to characterize molecular kinetics properties such as diffusion and/or dissociation rates (4,5). Particle tracking inside biological cells requires both the ability to spatially and temporally mark specific structures as well as the possibility of imaging at low background levels (3). PA-GFP (for photo and activatable) can be used as such a marker in live cell imaging (6,7).
Wild-type GFP exists as a mixture of neutral phenols and anionic phenolates, leading to a major absorption peak around 397 nm and a minor peak around 480 nm (6,8,9). Site-specific mutagenesis substituting Thr-203 with histidine successfully leads to an excellent photoconvertible molecule that produces a 100-fold increase in 488-nm excited fluorescence after irradiation with a high energy flux at 405 nm. Demonstration of PA-GFP photoactivation using confocal laser scanning microscopy has made it an optimal tool for studying the spatial and temporal dynamics of proteins in vivo. This has been recently shown in tracking lysosomes, mitochondria, and chromatin loci (6,10,11). The use of two-photon excitation (TPE) could provide several favorable aspects in comparison to single-photon confocal microscopy when photomarking biological structures that must be tracked (12,13). The confinement of light-matter interaction due to TPE photophysics provides unique control during the excitation and photoactivation process in a three-dimensional (3D) space (14,15). Even if single-photon confocal laser scanning microscopy can efficiently modulate excitation power in a planar submicron region, it fails to elicit the same control along the optical axis, as the excitation volume is extended along the entire depth of focus of the objective (16).
Compared to single-photon absorption, the TPE process shows a reduced Rayleigh scattering due to smaller frequencies (υ4-dependence) (17). Moreover, it yields a better signal/noise ratio and suffers smaller absorption losses (14). These features are particularly relevant when working with thick samples and especially when cell viability plays an important role. The ability to mark specific cells in living embryos by photoactivating biomolecular markers that allow cell viability can provide a unique tool in developmental biology studies that help in understanding cell fate and differentiation mechanisms (11).
Effort is consequently required to characterize the photophysical properties of biomolecules under TPE or multiphoton excitation. In fact, the rule of thumb of doubling the optimal single-photon excitation wavelength provides only a rough estimate about the behavior of fluorophors under TPE (18).
Fluorescent proteins exhibit unexpected properties that can be employed to efficiently mark cells or subcellular structures: DsRed, a red fluorescent protein cloned from tropical corals, shows, under three-photon excitation, an emission shift from red to green when subsequently observed under conventional excitation (19). GFP can be photoconverted by 488-nm excitation under low oxygen conditions (20), providing an efficient optical highlighter to mark subcellular structures. However, the different two-photon excitation spectra available for GFP wild-type and mutated variants suggests that a wide range of wavelengths can be employed to efficiently perform imaging and photoactivation: EGFP reaches a maximum at around λ = 920 nm, wild-type GFP around 800 nm, and GFPS65T a broad plateau for wavelength higher than 900 nm (21).
With our current studies, the photophysical properties of PA-GFP under TPE have been investigated to demonstrate the potential to employ TPE microscopy in combination with photoactivatable markers in protein dynamic studies.
PA-GFP exhibited the same photoconversion properties when irradiated in the TPE regime in comparison with photoactivation at 405 nm: an intense irradiation can induce an increase in absorption cross section at 488 nm and a consequently improved fluorescence emission.
This effect can be efficiently employed to mark submicron regions in well-defined 3D regions within the sample. Examination of the activated spatial volume, a function of the excitation energy, showed that intensity modulation can be efficiently used to induce spatially controlled protein photoconversion along the optical axis, providing a unique possibility to dynamically identify single 3D structures.
MATERIALS AND METHODS
Optical setup
Ti:sapphire laser sources, Tsunami 3960 (Spectra Physics, Mountain View, CA), and Chameleon-XR (Coherent, Santa Clara, CA) were used. Pulse-widths lie within the range of 100–140 fs full-width at half maximum at a repetition frequency of 80 MHz and 90 MHz, respectively, at the laser output window. The laser beam was coupled directly into the scanning head of a Leica TCS SP2 AOBS confocal microscope using an infrared port. The measurements were taken using an average power of 〈P〉min ∼ 2.5 mW up to 〈P〉max = 12.5 mW at the focal plane. Single-photon photoconversion was performed using a Leica TCS SP2 AOBS equipped with a 405-nm 10-mW laser diode. Imaging of the activated protein was obtained using the 488-nm line of a 20-mW Argon ion laser.
Sample preparation
Cell culture and transfection
Phoenix and HeLa cells were grown on coverslips under standard culture conditions at 37°C, 5% CO2 in a DMEM medium supplemented with 10% North American fetal bovine serum (Gibco Europe, Paisley, UK).
The PA-GFP was a generous gift from Dr. George Patterson. HeLa transient transfection was performed using a FuGene (Boehringer-Ingelheim Italia S.p.A., Milan, Italy) reagent according to manufacturer instructions. Cells were harvested and fixed after 48 h. Before mounting, coverslips were stained with the DNA dye TOPRO 3 (Molecular Probes Europe, Leiden, Netherlands) to facilitate cell identification.
Protein immunoprecipitation
Phoenix cells were transfected with PA-GFP encoding DNA using calcium phosphate. After 24 h, cells were lysed in a cold 1X PLC buffer (50 mM HEPES, 1.25% glycerol, 150 mM NaCl, 166 mM MgCl2, 1% TRITONX-100, 0.001% EGTA,10 mM NaPyruvate, 0.1 mM NaOrtovanadate, 0.01 mM PMSF, aprotinin, pepstatin, and leupeptin) on ice for 1 h. Cell lysates were incubated with an anti GFP polyclonal antibody and subsequently with ProteinA sepharose beads. Proteins immobilized on the surface of the beads were finally cross-linked with 4% paraformaldehyde, in the case of fixed samples. For imaging, beads were resuspended in a 90% glycerol solution that contained diazabicyclo-(2.2.2) octane antifade (Sigma Aldrich S.r.l., Milan, Italy).
The variation of the activation in dependence on the surface position of the spheres was found to be 10%. Therefore, several areas covering the whole sphere were activated and the intensities were compared (data not shown).
Data acquisition and imaging
Images were collected using a 100× oil N.A. = 1.4 objective HCX PL APO (Leica Microsystems S.p.A., Milan, Italy).
GFP was initially excited with λ = 488 nm to evaluate the preactivation intensity. The activation process was then primed by focusing a pulsed infrared laser beam on a 4.69 × 4.69 μm2 region (512 × 512 pixel). The scanning process on this area lasted 1.28 s and the dwell time per pixel was ∼5 μs. Subsequently, the unzoomed area was imaged using the acquisition parameters that were used before the activation process. The photoconversion processes were all performed with the same average power of the incident infrared beam. The image before and after activation were analyzed to determine the related mean intensity values. After spectral evaluation (data not shown), made possible by the spectral characteristics of the Leica SP2 AOBS scanning head, the spectral window used for collecting fluorescence was 500–600 nm accordingly to early reported emission spectra (6).
The modified spheres were sandwiched between an ethanol/acetone cleaned coverslip and a glass slide. To avoid drying, the sample was sealed with ordinary nail polish. This sandwiching technique produces squeezed spheres, so the protein-modified surface was flat and no longer curved at the interface. We could not observe any influence on the molecular behavior as a result from contact with the glass surface.
Two images were evaluated to determine the wavelength dependence activation: one before and one after the TPE photoconversion process. The ratio of mean fluorescence intensities of the activated area before and after activation was used to measure efficiency.
For the two-photon excitation spectrum the fluorescence intensity was collected as function of the excitation wavelength, keeping constant all the acquisition parameters. Care was taken to keep the probability to absorb two photons constant when changing the wavelength ( ) (12). For the excitation spectrum of the photoconverted PA-GFP molecules the background coming from the sphere was subtracted.
RESULTS AND DISCUSSION
The ability to induce fluorescence emission using two-photon excitation in PA-GFP expressing cells was initially verified. Therefore, we imaged transfected cells at different energies, extracting from related images the average intensities in selected areas. Imaging was performed under TPE at λ = 750 nm. Even though the overall intensity of the PA-GFP was weak, the cells could be tracked and regions of interest (ROI) could be selected due to the fact that the cell nuclei were stained with a DNA-specific dye (Topro 3) that showed a strong fluorescence signal due to two-photon excitation. In Fig. 1, the relationship between the excitation energy squared and the resulting mean intensity is depicted for PA-GFP (the nuclear dye Topro 3 was used as a counterstain and TPE data are shown in the inset of Fig. 1). Experimental data clearly exhibit a linear dependence (R = 0.999) of the fluorescence intensity on the squared excitation energy, typical of a TPE process.
FIGURE 1.

The graph depicts the relationship between the excitation energy and the fluorescence intensity of the PA-GFP protein produced by cells. The inset shows the dependence of the DNA marker Topro 3. Both fluorescence intensities show a linear dependence on the excitation energy squared. This reveals the underlying two-photon absorption process for the two dyes. The absorption energy is measured before the laser light was coupled into the scanning head of the microscope.
Further, indirect proof of two-photon induced emission is the thickness of the photoactivated volumes. The 3D spatially restricted activation is part of the proof that the activation process is based on TPE processes. Due to the locally restricted, nonlinear excitation probability, activated volumes of finite thickness were expected in dependence of the provided laser light intensity. Whereas single-photon induced activation should extend along the whole beam path of the light in the sample. A comparison between one-photon (λ = 405 nm) and two-photon activation process is shown in Fig. 2. The thickness of the two-photon activated volume is limited to a narrow region inside the cell, whereas in a fully activated cell, one-photon activation results in an axial direction (Fig. 2 c). In the two-photon irradiation, activation volume can be precisely tuned by varying the energy of the incoming laser beam, as depicted in Fig. 3. Several areas (performing a scan in the focal plane) were activated using different laser beam energies. The intensity profiles of these areas were plotted along the optical axis. Irradiation with an average laser power of 5 and 10 mW caused an increase in the thickness of the activated area. The change in the activated volume conforms with the expectation based upon the change in the intensity distribution I(z) of the incident laser light energy I0 (17)
 |
(1) |
where z is the distance from the focal plane and zR equals
 |
(2) |
(n is the refractive index of the specimen, λex is the excitation wavelength, and NA is the numerical aperture of the objective). Using the excitation wavelength, the numerical aperture, and the refractive index of the sample, it is possible to predict an arbitrary intensity value in dependence on the distance from the focal plane. With λex = 750 nm, NA = 1.4, n = 1.518, and with an excitation power of 10 mW, an intensity value of ∼0.36 at a distance of 3.5 μm can be estimated. This intensity value represents the edge between activated and unactivated volumes and can therefore be considered as the activation threshold. The intensity value will be reached at different distances from the focal plane for different laser powers. Using this value, the approximate extension of the activation volume in the z-direction can be calculated (see also Table 1). Using 5 mW as the activation power, the intensity threshold value is obtained at a distance of z = z5 = 2.4 μm from the focal plane. This value conforms well with the one extracted from the measurement (zROI 2 = 2.35 μm). These intensity values are arbitrary and the calculations were based on the energy values measured before the laser beam was coupled into the scanning head. This should be pointed out again to avoid misunderstandings about the values provided in the previous section. Furthermore, the agreement between the calculated and the measured values potentiates the conclusion that saturation effects do not play a major role. Hence, the small differences could be attributed to weak saturation in the beam center (22).
FIGURE 2.

(a) Image taken along the xz-plane showing the slight fluorescence from the cell as well as the two-photon activated volume (25 mW, two averaging lines, λ = 750 nm). The volume of the cell is surrounded by a white dotted line to highlight its shape. It can be clearly seen that the two-photon induced activation process is restricted to a finite volume and does not activate the whole cell. The extension in the z-direction of the activated volume is ∼3 μm. For comparison, cells are depicted in the xz-plane with λ = 405 nm (b). Activation was performed with intensive laser light at λ = 405 nm. In panel c, an xz-micrograph after excitation at λ = 488 nm of the same cells is shown. It can be seen that the whole cell is activated in the z-direction (∼10 μm) and the nonactivated areas are barely visible.
FIGURE 3.

Overview image of a fixed cell expressing PA-GFP. Several areas were excited and the intensity in the z-direction is depicted in Table 1. ROI 1 covers an area activated with P = 5 mW (before coupling into the scanning head, ≅ 2.5 mW at the focal plane for this optical setup) with four averaging lines. The resulting thickness of the activated area is dROI1 ∼ 2.35 μm. ROI 2 was activated with ∼10 mW, two averaging lines, and ROI 3 had the same energy but was not repeatedly scanned. The thickness of the activated volume increases with the laser light energy and is also affected by the number of activation cycles (dROI2 ∼ 3.5 μm and dROI 3 ∼ 3.0 μm).
TABLE 1.
Extension in the z-direction of the activated areas in dependence of the energy and the time per pixel used for the activation process
| ROI | Scan time per pixel (μs) | Activation power (mW) | FWHMI(z) (μm) |
|---|---|---|---|
| 1 | 19.6 | 5 | 2.35 |
| 3 | 4.9 | 17 | 3 |
| 2 | 9.8 | 10 | 3.5 |
The power values given correspond to the laser power before entering the scanning head of the microscope.
In addition, the dwell time for each pixel also has an influence (7). Activating two areas with laser energy 1.5 times higher, but with a reduced repetition rate, results in slightly different activated volumes (ROI 2 and ROI 3) and intensities. Especially at the edges of the activation voxel, it is more probable that the conditions for two-photon absorption will not be fulfilled. Fewer activated molecules per scan are the result. This effect will add up for consecutive activation scans.
High-energy 405-nm irradiation caused PA-GFP photoconversion, leading to a dramatic decrease in the absorption cross section at this wavelength (Fig. 4). HeLa cells expressing PA-GFP were imaged using a laser diode at 405 nm at low intensity (15% of the maximum power) (panel a); 488-nm excitation produced a very dim signal (b) (acquisition settings were chosen to avoid signal saturation after activation (d)). Intense irradiation of a selected region at 405 nm caused the expected shift in the spectral properties, showing reduced absorption at 405 nm (c) and enhanced excitation and emission (d). Two-photon activation showed the same phenomena abolishing two-photon imaging after activation of the activated areas (Fig. 5, a and b).
FIGURE 4.

PA-GFP photoactivation using single-photon excitation. HeLa cells expressing PA-GFP were imaged using a laser diode at 405 nm at low intensity (15% of the maximum power) (A). Before activation, PA-GFP expressing cells showed very low intensity when excited at 488 nm (B). Intense irradiation of a selected region at 405 nm caused the expected shift in the spectral properties, showing reduced absorption at 405 nm (C) and enhanced excitation and emission at 488 nm (D).
FIGURE 5.
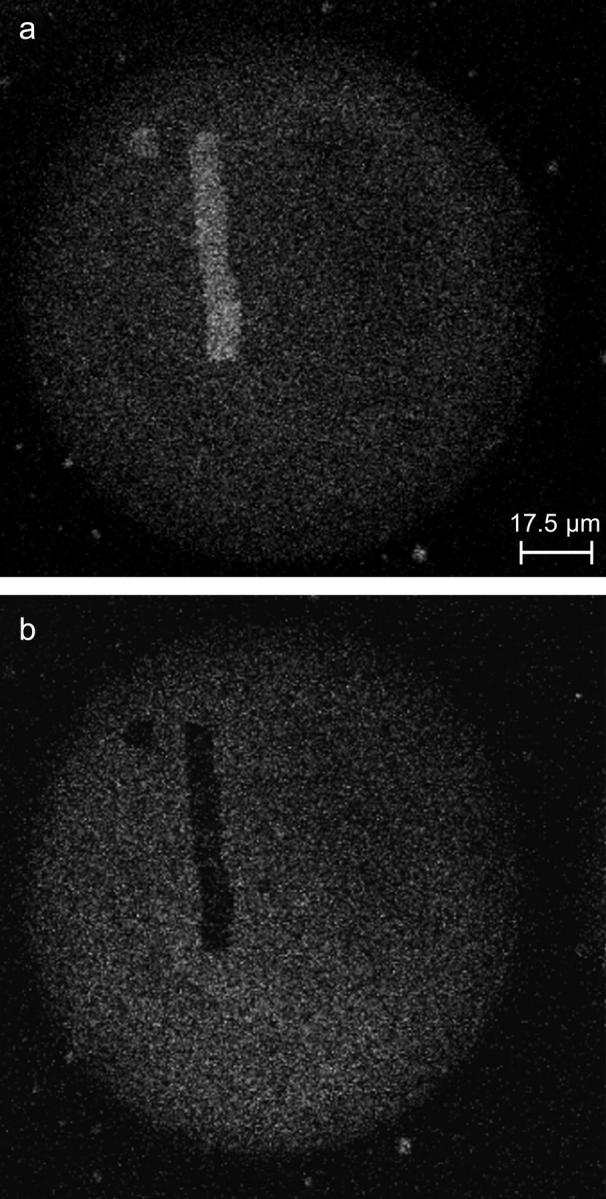
(a) Fluorescence micrograph of a PA-GFP modified sphere surface after an activation cycle with two photons at different wavelength. The sample was irradiated with 488 nm. The increased fluorescence intensity of several areas due to the activation can be clearly seen. Imaging the same area using two-photon induced fluorescence processes at λex = 750 nm, we obtained an image where the activated regions are nonexcitable and therefore do not yield fluorescence (b).
The point mutation used in the production of PA-GFP caused an almost complete depletion of the wild-type GFP absorption properties around 490 nm, while keeping the excitation spectra essentially unaltered in the near-UV region. Photoconversion leads to a change in the excitation that made the activated PA-GFP more similar to the EGFP version. Consequently, these photophysical properties were analyzed when excitation stemmed from a nonlinear absorption process. Analysis of the excitation properties of the nonactivated form showed an increasing fluorescence from 720 to 800 nm as known for wild-type GFP (23). Surprisingly, a drop in the fluorescence intensity occurred, followed by a sharp rise at λ = 820 nm, only to fade off at higher wavelengths (Fig. 6 a). This finding seems to be supported by recently published data on two-photon excitation of single E2GFP molecules, another photoswitchable GFP mutant (24). Two clearly separated absorption bands for two-photon absorption at λ = 780 nm and λ = 870 nm were also found. These absorption peaks are attributed to an anionic and a neutral state of the molecule (24–26).
FIGURE 6.

(a) Fluorescence intensity after two-photon excitation in dependence of the excitation wavelength. The black spots represent the fluorescence intensity from the nonactivated protein. The dotted line through these data points is a visual guide and represents the moving average of the data (For this reason the peak around 820 nm is not highlighted). The triangular points represent the fluorescence intensity of the activated areas on the sphere. Again, as a visual guide, the dashed line resulting from the moving average is inserted. Error values represent standard deviation. For clarity, the λ error is not displayed. The uncertainty of the wavelength is ±5 nm. The activated areas on the surface of the PA-GFP modified sphere show fluorescence light emission at higher wavelength. For excitation with λ = 900 nm, the background fluorescence of the nonactivated area is small (in the highlighted area), and the fluorescence of the previously activated areas is clearly visible (b). The fluorescence intensity data of the activated areas in panel a are corrected due to the individual background fluorescence of the sphere at the relevant wavelength.
Overall, the cross section for the two-photon absorption corresponds to the known cross section of wild-type GFP. Fluorescence vanishes in the activated areas when irradiating in the 720–840 nm spectral range (see also Fig. 5 b).
For higher excitation wavelengths (≥850 nm), the photoactivated protein can be excited showing a stronger fluorescence than the surrounding area containing a native protein (Fig. 6, a and b). The activation process switches the excitation spectrum of PA-GFP from wild-type GFP to that of EGFP (Fig. 6 a) (21,23).
Moreover, the photoactivation efficiency as function on the activation wavelength was investigated. Activation wavelengths between 720 and 840 nm possess the ability to activate PA-GFP molecules. Above 820 nm, this ability starts to decrease, showing a cutoff after 840 nm (Fig. 7). For wavelengths in the region 720–775 nm, the activation behavior does not overlap completely with the two-photon excitation spectrum reported in Fig. 6 a. For those wavelengths the activation efficiency is higher and shows only small variations. This difference between the excitation spectrum (Fig. 6 a) and the photoconversion efficiency (Fig. 7) could be explained with two different approaches.
FIGURE 7.

Dependence of the activation of PA-GFP on the wavelength used for irradiation as measured on unfixed fresh specimens. The original data were the ratio between the mean fluorescence intensity before and after activation of a defined area of the specimen. The displayed data were normalized to the value obtained at 750 nm. This was done for each independent measurement before combining them to the shown spectrum. The error bars represent the standard error for the distribution of the mean values, which were obtained from several independent measurements. Another intrinsic error is due to the concentration differences of PA-GFP, which was found to be 10%. The uncertainty of the wavelength is ±5 nm.
As a first approach, one should consider the two-photon fluorescence action cross section, δf, of the chromophore, defined as the product of the absorbance cross section of the molecule, δa, and the two-photon quantum efficiency, Q2f,  For the photoswitching process a similar action cross section can be defined
  δsw is the product of the two-photon absorption cross section, δa, and the switching quantum efficiency Qsw2. In our experiments δf is accessible as the fluorescence intensity in dependence on the wavelength (720–920 nm) and δsw is represented by the fluorescence intensity obtained by one-photon excitation (488 nm) after the photoactivation process initiated under TPE regime. For both processes the absorption cross sections δa should be equal. Taking into account the two mechanisms, fluorescence emission and photoconversion, which includes a decarboxylation and molecular rearrangements (6,9) it seems reasonable to assume different quantum efficiencies for the two processes. This could lead to the observed discrepancy between the excitation spectrum and the photoactivation spectrum. For other dye molecules such different behavior was already observed (27).
A second approach could be related to the possible absorption of the background or better of the surrounding GFP protein (β-barrel). It was already shown for λ = 800 nm, that this effect can have a tremendous influence (28). For the decarboxylation and the formation of the anionic GFP fluorophore it seems not to be necessary that the energy is exclusively absorbed by the chromophore itself. One should keep in mind, that the energy needed to induce the decarboxylation and to form the anionic form of the chromophore (∼1 kJ/mol (9)) is low when compared to the amount deposited by the absorption of one or two photons in the molecule. Competition of the two effects could weaken or even increase themselves.
However, from our data we could not gain a clear insight in the effects determining the photoswitching and the difference between the action cross section of two-photon induced fluorescence and the two-photon induced photoconversion.
CONCLUSION
We have shown that the photoswitchable variant of GFP, which is typically activated with high-intensity light at λ = 413 nm, can be activated by two-photon absorption as well. The spectral region used for checking two-photon activation and excitation ranged from 720 to 920 nm. Photoactivation under a two-photon regime was reported for the first time in the region from 720 to 780 nm. Moreover, it was achieved until 840 nm. For higher wavelengths (>840 nm), the two-photon activation and excitation efficiencies drop toward small values. Additionally, the well-confined activation volume available via two-photon processes offers a wide variety of possible applications from prolonged intracellular diffusion studies to optoelectronic data storage.
Acknowledgments
We are indebted to Silke Krol, Donna-Arndt Jovin, and Atsushi Miyawaki for interesting and stimulating discussions, and to Raffaella Magrassi, Dario Parazzoli, Paolo Bianchini, and Giuseppe Vicidomini for their technical help. We warmly acknowledge Prof. G. H. Patterson for providing the PA-GFP molecules. A.D. dedicates this study to the memory of Gianfranco Menestrina (1954-2004).
This study was partly supported by the EU Project HPRN-CT-2000-00159, the COFIN-MIUR project 2004–2005, IFOM (FIRC Foundation for Molecular Oncology), and INFM (National Institute for the Physics of the Matter).
References
- 1.Tsien, R. Y. 1998. The green fluorescent protein. Annu. Rev. Biochem. 67:509–544. [DOI] [PubMed] [Google Scholar]
- 2.Zimmer, M. 2002. Green fluorescence protein (GFP): applications, structure, and related photophysical behavior. Chem. Rev. 102:759–781. [DOI] [PubMed] [Google Scholar]
- 3.Lippincott-Schwartz, J., N. Altan-Bonnet, and G. H. Patterson. 2003. Photobleaching and photoactivation: following protein dynamics in living cells. Nat. Cell Biol. Suppl:S7–S14. [PubMed]
- 4.Phair, R. D., S. A. Gorski, and T. Misteli. 2004. Measurement of dynamic protein binding to chromatin in vivo, using photobleaching microscopy. Methods Enzymol. 375:393–414. [DOI] [PubMed] [Google Scholar]
- 5.Stavreva, D. A., and J. G. McNally. 2004. Fluorescence recovery after photobleaching (FRAP) methods for visualizing protein dynamics in living mammalian cell nuclei. Methods Enzymol. 375:443–455. [DOI] [PubMed] [Google Scholar]
- 6.Patterson, G. H., and J. Lippincott-Schwarz. 2002. A photoactivatable GFP for selective photolabeling of proteins and cells. Science. 297:1873–1877. [DOI] [PubMed] [Google Scholar]
- 7.Patterson, G. H., and J. Lippincott-Schwartz. 2004. Selective photolabeling of proteins using photo activatable GFP. Methods. 32:445–450. [DOI] [PubMed] [Google Scholar]
- 8.Brejc, K., T. K. Sixma, P. A. Kitts, S. R. Kain, R. Y. Tsien, M. Ormo, and S. J. Remington. 1997. Structural basis for dual excitation and photoisomerization of the Aequorea victoria green fluorescent protein. Proc. Natl. Acad. Sci. USA. 94:2306–2311. [DOI] [PMC free article] [PubMed] [Google Scholar]
- 9.van Thor, J. J., T. Gensch, K. J. Hellingwerf, and L. N. Johnson. 2002. Phototransformation of green fluorescent protein with UV and visible light leads to decarboxylation of glutamate 222. Nat. Struct. Biol. 9:37–41. [DOI] [PubMed] [Google Scholar]
- 10.Karbowski, M., D. Arnoult, H. Chen, D. C. Chan, C. L. Smith, and R. J. Youle. 2004. Quantitation of mitochondrial dynamics by photolabeling of individual organelles shows that mitochondrial fusion is blocked during the Bax activation phase of apoptosis. J. Cell Biol. 164:493–499. [DOI] [PMC free article] [PubMed] [Google Scholar]
- 11.Post, J. N., K. A. Lidke, B. Rieger, and D. J. Arndt-Jovin. 2005. Photoactivation of PAGFP in live Drosophila embryos: two-photon activation and phototoxicity. FEBS Lett. 579:325–330. [DOI] [PubMed] [Google Scholar]
- 12.Denk, W., J. H. Strickler, and W. W. Webb. 1990. Two-photon laser scanning fluorescence microscopy. Science. 248:73–76. [DOI] [PubMed] [Google Scholar]
- 13.Diaspro, A. 2002. Confocal and Two-Photon Microscopy: Foundations, Applications, and Advances. A. Diaspro, editor. Wiley-Liss, New York, NY.
- 14.Centonze, V. E., and J. G. White. 1998. Multiphoton excitation provides optical sections from deeper within scattering specimens than confocal imaging. Biophys. J. 75:2015–2024. [DOI] [PMC free article] [PubMed] [Google Scholar]
- 15.Diaspro, A., and M. Robello. 2000. Two-photon excitation of fluorescence for three-dimensional optical imaging of biological structures. J. Photochem. Photobiol. B 55:1–8. [DOI] [PubMed] [Google Scholar]
- 16.Bianco, B., and A. Diaspro. 1989. Analysis of the three-dimensional cell imaging obtained with optical microscopy techniques based on defocusing. Cell Biophys. 15:189–200. [DOI] [PubMed] [Google Scholar]
- 17.Stelzer, E. H. K., S. Hell, S. Lindek, R. Stricker, R. Pick, C. Storz, G. Ritter, and N. Salmon. 1994. Nonlinear absorption extends confocal fluorescence microscopy into the ultra-violet regime and confines the illumination volume. Optics Communications. 104:223–228. [Google Scholar]
- 18.Xu, C., R. M. Williams, W. Zipfel, and W. W. Webb. 1996. Multiphoton excitation cross-sections of molecular fluorophores. Bioimaging. 4:198–207. [Google Scholar]
- 19.Marchant, J. S., G. E. Stutzmann, M. A. Leissring, F. M. LaFerla, and I. Parker. 2001. Multiphoton-evoked color change of DsRed as an optical highlighter for cellular and subcellular labeling. Nat. Biotechnol. 19:645–649. [DOI] [PubMed] [Google Scholar]
- 20.Jakobs, S., A. C. Schauss, and S. W. Hell. 2003. Photoconversion of matrix targeted GFP enables analysis of continuity and intermixing of the mitochondrial lumen. FEBS Lett. 554:194–200. [DOI] [PubMed] [Google Scholar]
- 21.Xu, C. 2002. Cross-Sections of Fluorescence Molecules in Multiphoton Microscopy. In Two-Photon-Excitation Microscopy: Foundations, Applications, and Advances, 1st Ed. A. Diaspro, editor. Wiley-Liss, New York. 75–99.
- 22.Cianci, G. C., J. Wu, and K. Berland. 2004. Saturation modified point spread functions in two-photon microscopy. Microsc. Res. Tech. 64:135–141. [DOI] [PubMed] [Google Scholar]
- 23.Xu, C., W. Zipfel, J. B. Shear, R. M. Williams, and W. W. Webb. 1996. Multiphoton fluorescence excitation: new spectral windows for biological nonlinear microscopy. Proc. Natl. Acad. Sci. USA. 93:10763–10768. [DOI] [PMC free article] [PubMed] [Google Scholar]
- 24.Chirico, G., F. Cannone, A. Diaspro, S. Bologna, V. Pellegrini, R. Nifosi, and F. Beltram. 2004. Multiphoton switching dynamics of single green fluorescent proteins. Phys. Rev. E Stat. Nonlin. Soft Matter Phys. 70:030901–030904. [DOI] [PubMed] [Google Scholar]
- 25.Blab, G. A., P. H. M. Lommerse, L. Cognet, G. S. Harms, and T. Schmidt. 2001. Two-photon excitation action cross-sections of the autofluorescent proteins. Chem. Phys. Lett. 350:71–77. [Google Scholar]
- 26.Kummer, A. D., C. Kompa, H. Lossau, F. Pollinger-Dammer, M. E. Michel-Beyerle, C. M. Silva, E. J. Bylina, W. J. Coleman, M. M. Yang, and D. C. Youvan. 1998. Dramatic reduction in fluorescence quantum yield in mutants of green fluorescent protein due to fast internal conversion. Chem. Phys. 237:183–193. [Google Scholar]
- 27.Furuta, T., S. S. H. Wang, J. L. Dantzker, T. M. Dore, W. J. Bybee, E. M. Callaway, W. Denk, and R. Y. Tsien. 1999. Brominated 7-hydroxycoumarin-4-ylmethyls: photolabile protecting groups with biologically useful cross-sections for two photon photolysis. Proc. Natl. Acad. Sci. USA. 96:1193–1200. [DOI] [PMC free article] [PubMed] [Google Scholar]
- 28.Kirkpatrick, S. M., R. R. Naik, and M. O. Stone. 2001. Nonlinear saturation and determination of the two-photon absorption cross section of green fluorescent protein. J. Phys. Chem. B. 105:2867–2873. [Google Scholar]