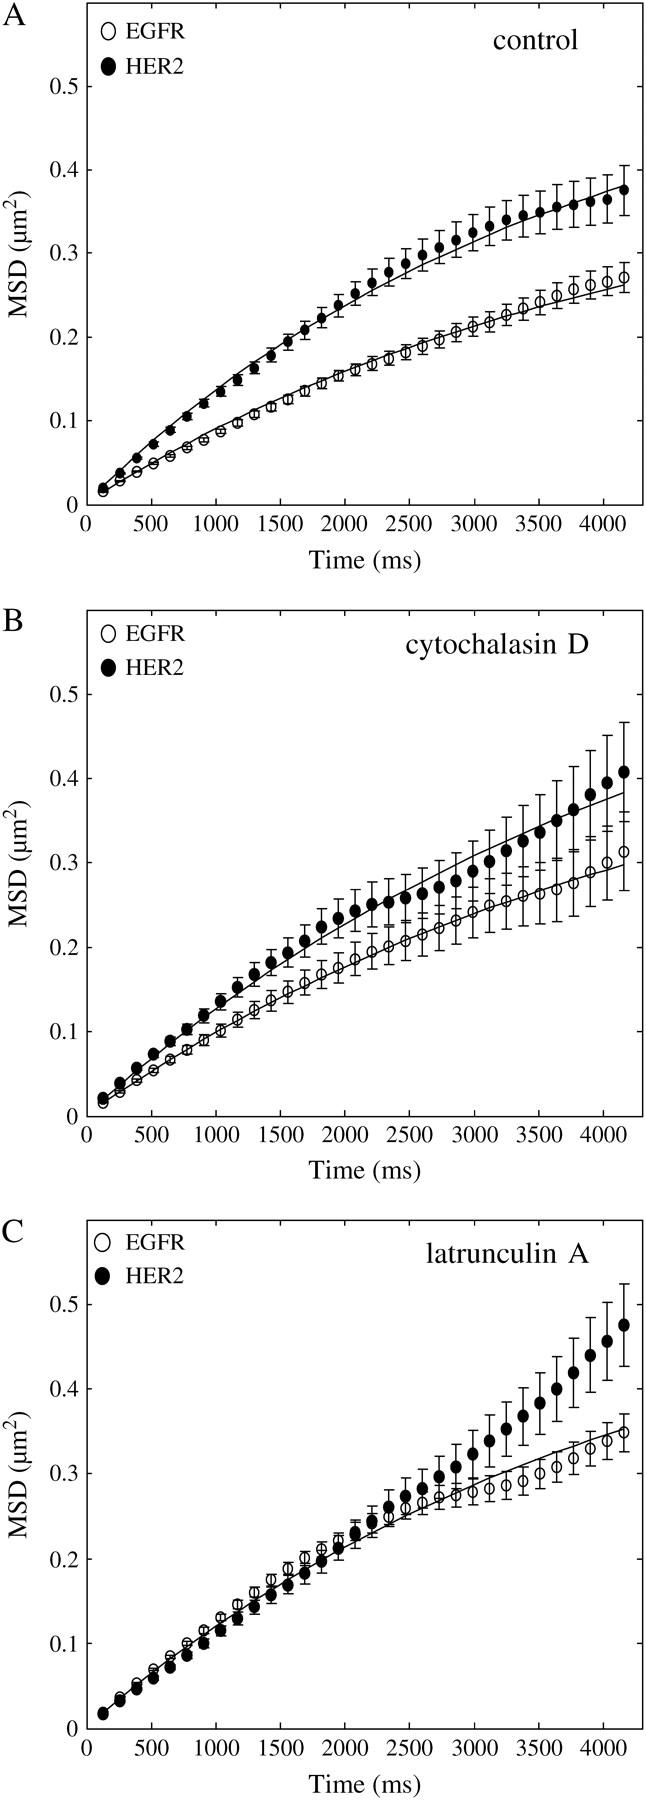
FIGURE 4.

Change in MSD over time, as calculated from traces of individual receptors, identified microdomain confinements within which HER2 diffused faster than EGFR. (A) The nonlinear change of MSD over time, as calculated from 180 traces of individual EGFR (○) and 120 traces of individual HER2 molecules, suggests that the receptors were confined within microscale domains. By fitting the curves with the equation for confined diffusion (solid line) and assuming a square shape, the confinement area was found to be 1.23 ± 0.06 μm for EGFR and 1.65 ± 0.16 μm for HER2. The diffusion coefficient of the receptors was calculated from the linear part of the curve (closer to time 0), showing that HER2 was more mobile (0.035 ± 0.004 μm2/s) than EGFR (0.023 ± 0.002 μm2/s). (B) Treating the cells with cytochalasin D to depolymerize F-actin increased the diffusion coefficient of EGFR (0.027 ± 0.003 μm2/s, n = 40, ○) but did not change the diffusion coefficient of HER2 (0.035 ± 0.004 μm2/s, n = 40, •). The toxin also extended the boundaries of the restricted domains of both receptors (EGFR: 1.5 ± 0.19 μm; HER2: 1.95 ± 0.29 μm). (C) Using a more potent drug to depolymerize F-actin, latrunculin A, led to the increase in the diffusion coefficient of EGFR (0.032 ± 0.003 μm2/s, n = 180, ○) to the same level as that of HER2. The diffusion coefficient of HER2 was not changed by the toxin (0.029 ± 0.003 μm2/s, n = 70, •). As indicated by the linear change of MSD with time, the toxin extended the boundaries of HER2 restricted domains beyond the ability of the experiment to detect them, which was limited by the photobleaching time of the individual molecules. Latrunculin A extended the boundaries of EGFR restricted domains to the same level as that of HER2 under normal conditions (1.65 ± 0.1 μm). These observations suggest that the direct interaction of EGFR with F-actin slows down the motion of the receptor in the plane of the membrane.
