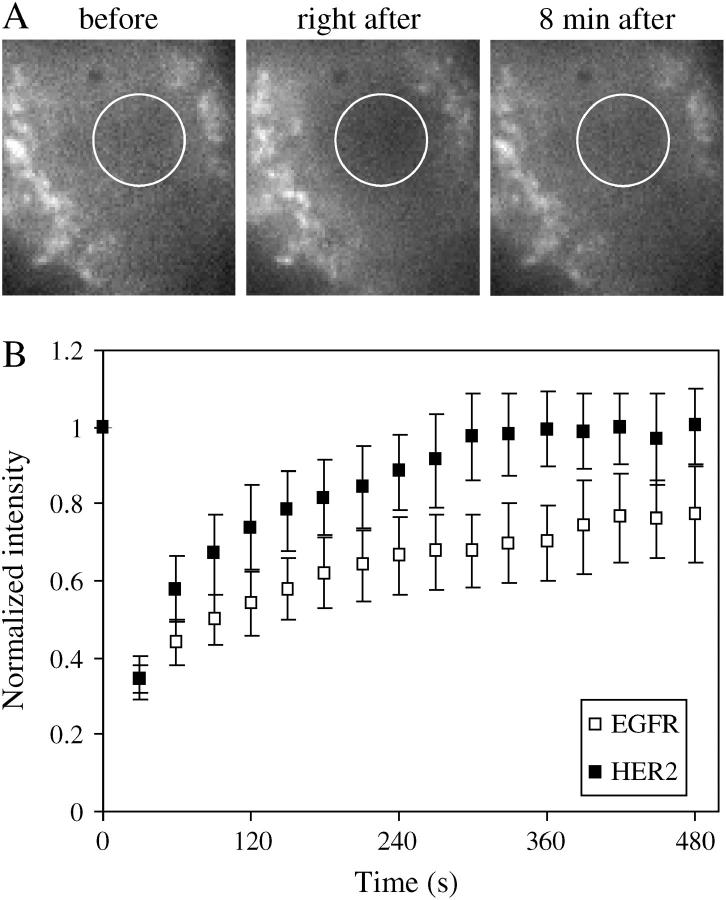
FIGURE 8.
Single-molecule measurements represent the whole population as determined by ensemble FRAP measurements. (A) An example of images that were used for calculating FRAP, where the diameter of the laser beam is indicated by the circle at FWHM (2.5 μm). (B) Normalized fluorescence intensities were plotted against time (images taken every 30 s), and the diffusion coefficient of the receptors was calculated as described in the text. The diffusion coefficient calculated by FRAP for EGFR (0.014 ± 0.007 μm2/s, n = 10 cells, □) and HER2 (0.022 ± 0.01 μm2/s, n = 10 cells, ▪) show the same tendency of a higher diffusion coefficient for HER2 relative to EGFR, as was found by single-molecule tracking.

