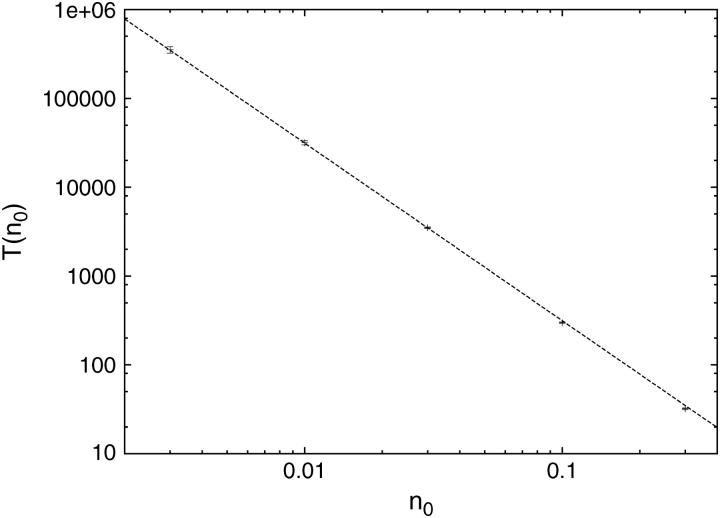
FIGURE 4.
Mean first passage time T(n0) of target search on a large, one-sided system (one target located at x = 0), as a function of the density n0 of excluding walkers that cannot occupy the same lattice site. The maximum density is n0 = 30%. The dashed line corresponds to the exact result  for dimensionless diffusion coefficient
  from Eq. 16 obtained in the continuum approximation. We see a slight deviation for larger densities. Each data point corresponds to 105 runs, except for 103 realizations for the lowest density. Note the comparatively small error bars.

