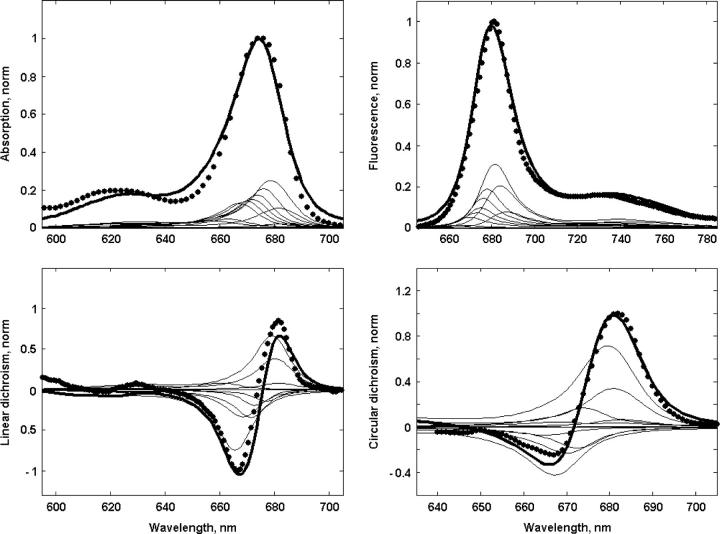
FIGURE 1.
Fit of the linear spectra (OD, LD, CD, and steady-state FL) at room temperature. Experimental OD and steady-state FL data measured in Andrizhiyevskaya et al. (16) and LD and CD states (E. G. Andrizhiyevskaya, unpublished results) are shown by points, a calculation according to Model B, assuming the 21-23-25 charge separation scheme, is shown by solid lines. Thin lines correspond to the exciton components of the overall spectra.

