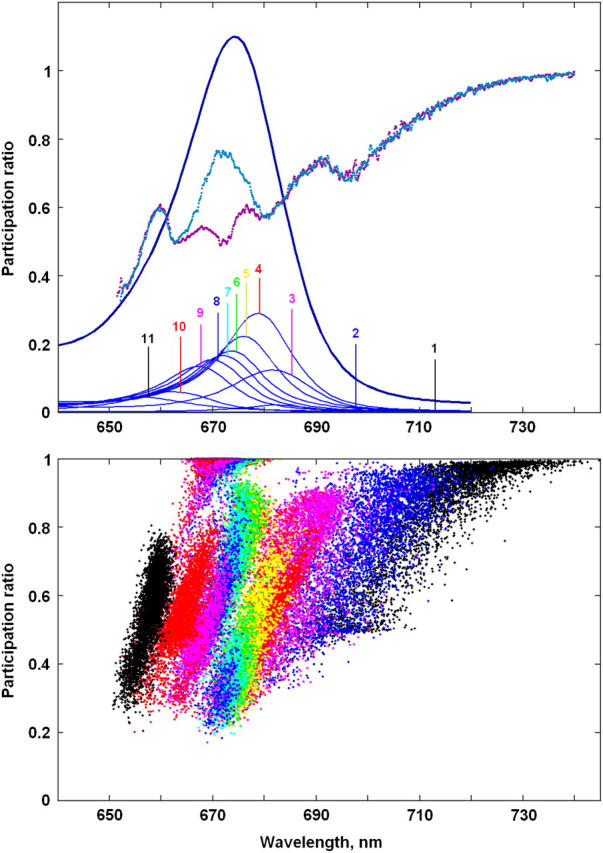
FIGURE 2.

Participation ratio (PR) of the exciton states for Model B. (Top frame) OD spectrum with the exciton components (the same as in Fig. 1) together with the PR as a function of the wavelengths corresponding to the zero-phonon lines (ZPL) of the exciton states. Bars 1–11 show the averaged positions of ZPLs for the exciton states from k = 1 to k = 11. Blue and magenta curves show PR averaged over disorder with (blue) and without (magenta) including the states localized at peripheral Chlzs. (Bottom frame) PR as a function of ZPL shown for 4000 realizations of the disorder. Each realization is presented by 11 points (shown by different colors) corresponding to a PR for the exciton states k = 1–11. Colors of the exciton states correspond to the colors of the bars in the top frame.
