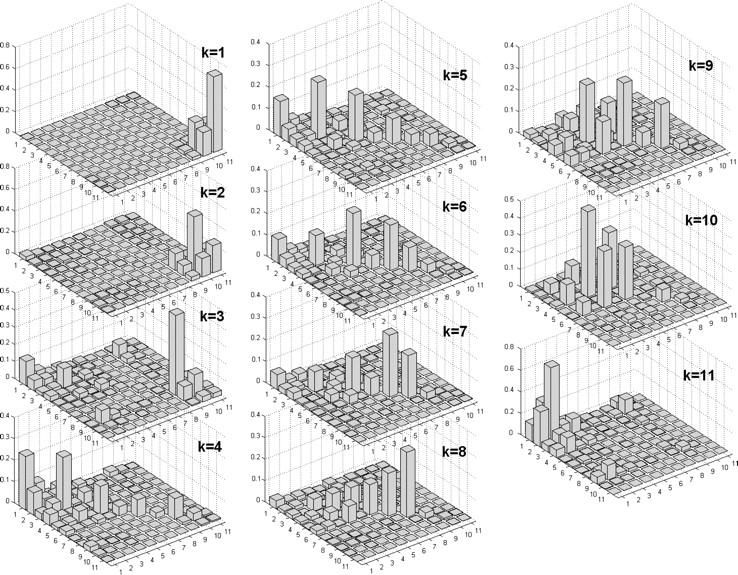
FIGURE 3.

Density matrix for the exciton states from k = 1 to k = 11 averaged over disorder. Bars show the density matrix elements (n,m) in the site representation. Numbers of the sites correspond to the eight pigments and three radical pairs in the following order: 1, PD1; 2, PD2; 3, ChlD1; 4, ChlD2; 5, PheD1; 6, PheD2; 7, ChlzD1; 8, ChlzD2; 9, RP1; 10, RP2; and 11, RP3. Data corresponds to Model B with 21-23-25 charge separation scheme.
