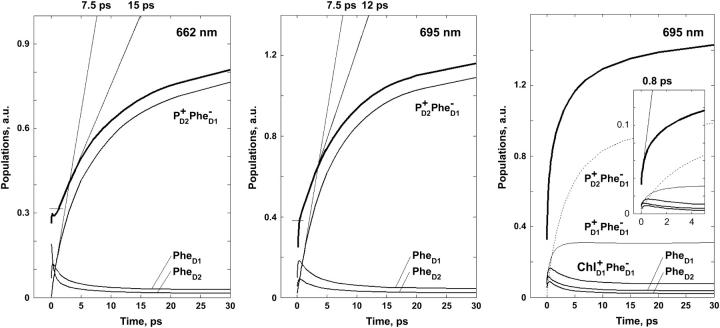
FIGURE 7.
Dynamics of the Phe bleaching and  formation calculated according to Model B with different charge-separation schemes. (Left frame) Populations of PheD1, PheD2, and radical pair
  are shown for the 21-23-25 scheme upon 662-nm excitation, together with the sum of these kinetics (giving the Phe bleaching). Horizontal bar shows the amplitude of the instantaneous bleaching. (Middle frame) The same as in left frame, but for 695-nm excitation. (Right frame) Populations of two Phes and of three radical pairs involving
  are shown for the 35-15-25 scheme with 695-nm excitation, together with the sum of these kinetics (giving the Phe bleaching for this scheme).

