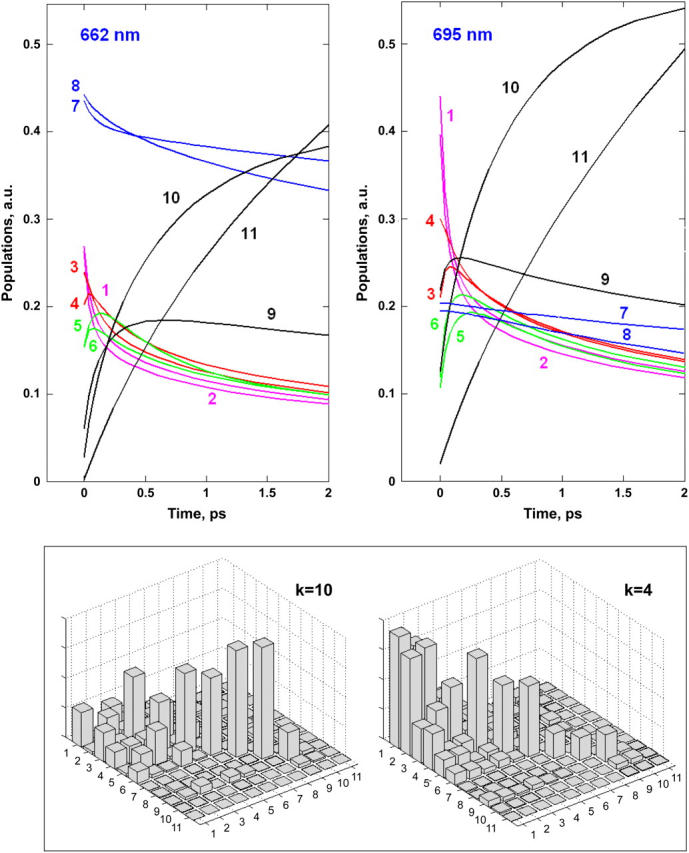
FIGURE 8.

Site populations and density matrix for the multimer Model A. Population kinetics are shown upon 662- and 695-nm excitation (colors of the sites are the same as in Figs. 4 and 5). The density matrix (with the same representation as in Fig. 3) is shown for the k = 10 and k = 4 states, which are initially most populated upon 662- and 695-nm excitation, respectively.
