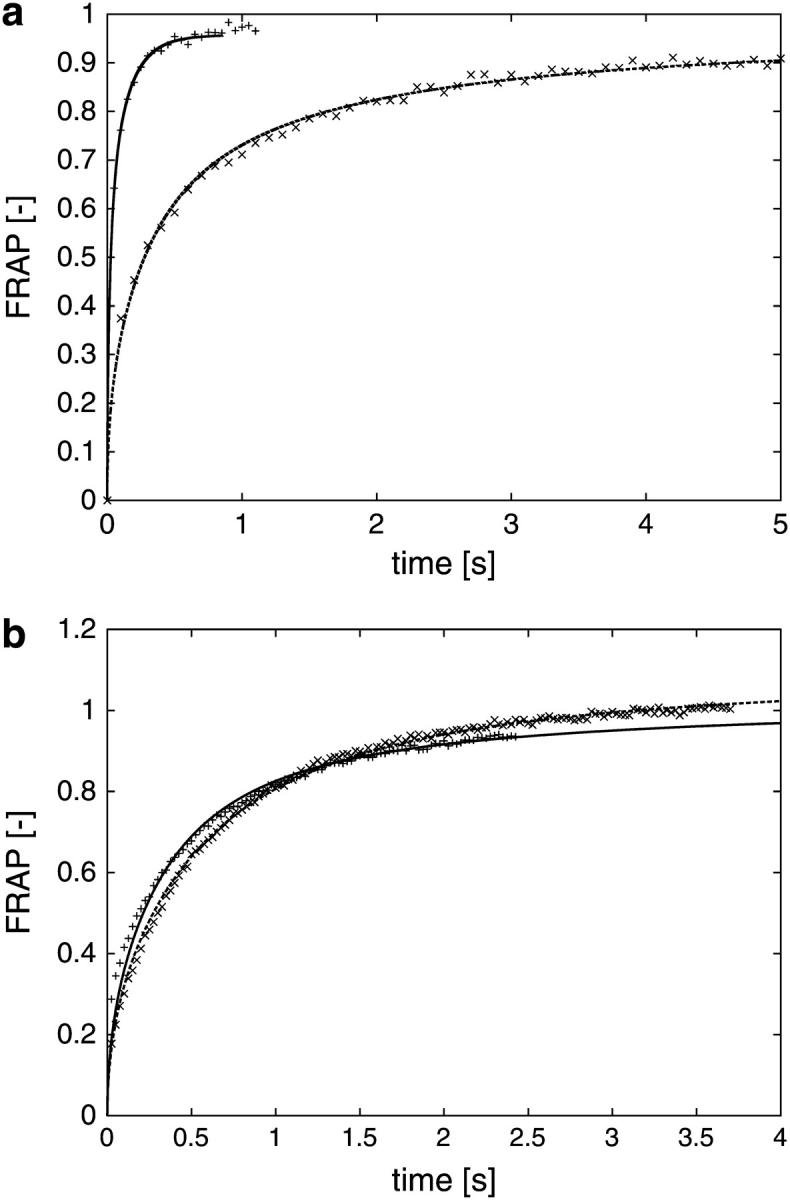
FIGURE 3.

(a) Simulated FRAP curves compared to experimental measurement data for different ER. The computer simulations are done using the method of particle strength exchange as outlined in the Materials and Methods section. The experiment is a standard FRAP experiment, preceded by the recording of a stack of serial sections used for the reconstruction of the geometry. The simulated FRAP curves (lines) are stretched in time to fit the experimental data (symbols). As time and diffusion constant are inversely proportional, this allows us to estimate the molecular diffusion constant while fully taking the specific geometry into account (cf. main text). For the two examples shown, the molecular diffusion constants are determined to be 34.4 μm2/s (faster curve, +), and 34.2 μm2/s (slower curve, ×), respectively. All curves are normalized by their asymptotic value to allow comparison. (b) Simulated FRAP curves compared to experimental measurement data for different locations of the bleached region. Two FRAP experiments, followed by corresponding PSE simulations, performed for two different, but overlapping, bleached regions in the same ER. The result after fitting the simulation results (lines) to the measurement (symbols) is shown. The two bleached regions are given in microscope coordinates as: × (191,190)–(229,228) and + (218,196)–(256,234), corresponding to 4 × 4 μm, and the molecular diffusion constants are 1.8 μm2/s (×) and 1.6 μm2/s (+), respectively. All curves are normalized by their asymptotic value to allow comparison.
