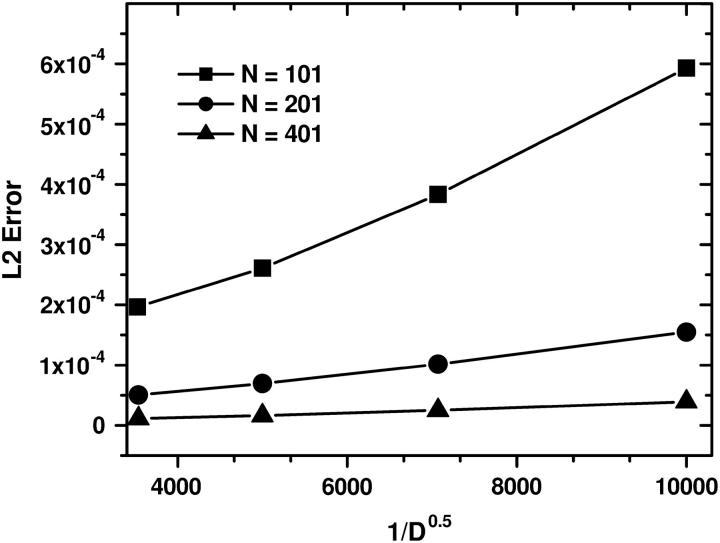
FIGURE 12.
The averaged L2-error |c – cref| versus  of the ASTFEM solution for experiments of various diffusion coefficient D. Here the rotor speed was simulated at 50,000 rpm, s = 10−12, and m = 5.8, b = 7.2. This graph indicates that the accuracy of an ASTFEM solution increases as the diffusion coefficient D increases. The same conclusion is also true for Claverie's solution and the moving hat solution.

