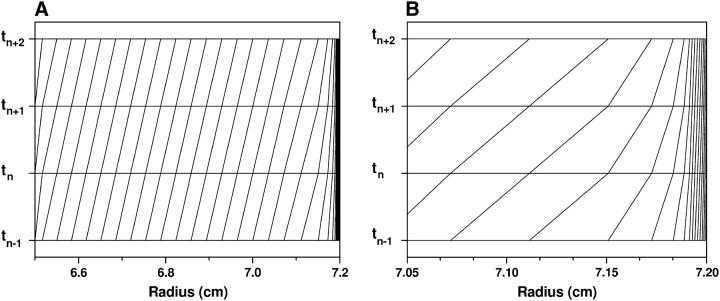
FIGURE 3.
ASTFEM grid point distribution for four successive time-steps. A shows the distribution for the entire cell, and in B a zoom of the region near the bottom is shown, clearly identifying the increased density of gridpoints at the bottom of the cell where the change of concentration is the largest and the highest resolution is needed.

