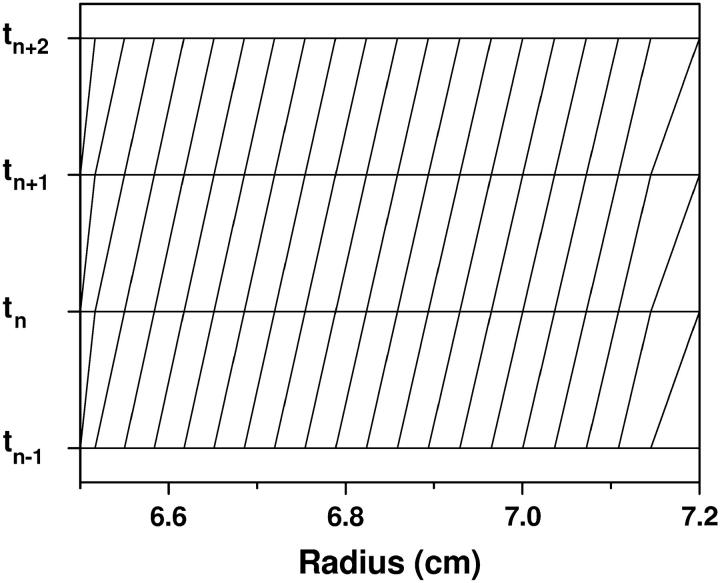
FIGURE 7.
A typical grid used in the moving hat method for four successive time-steps. The radial distribution of the grid points is determined according to Eq. 16. The grid point density decreases toward the bottom of the cell, with the largest spacing at the bottom of the cell, where the highest resolution is actually needed.

