
FIGURE 8.
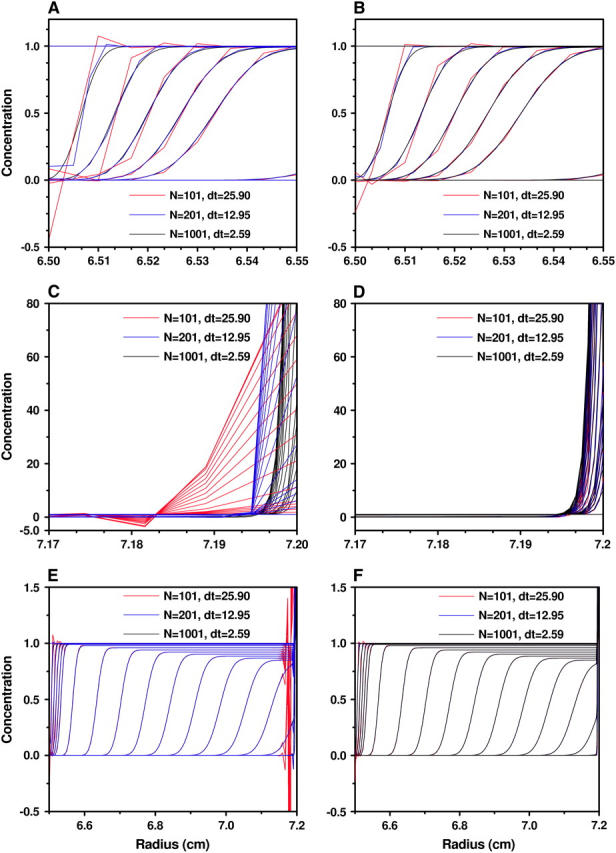
Concentrations obtained by the moving hat method (A, C, and E) and the ASTFEM method (B, D, and F) with various N and δt for Example 1 (m = 6.5 cm, b = 7.2 cm, s = 10−12, D = 2 × 10⁻⁷, 60,000 rpm, 9000 s). (A and B) The concentrations near the meniscus. (C and D) The concentrations near the bottom of the cell. (E and F) The concentrations on the entire cell. The largest difference can be noticed at the bottom of the cell (C and D), where the moving hat method is poorly conditioned. The oscillations near the meniscus are reduced for the ASTFEM method (A and B), and can be significantly reduced for both solutions when slow rotor acceleration is modeled in the solution.