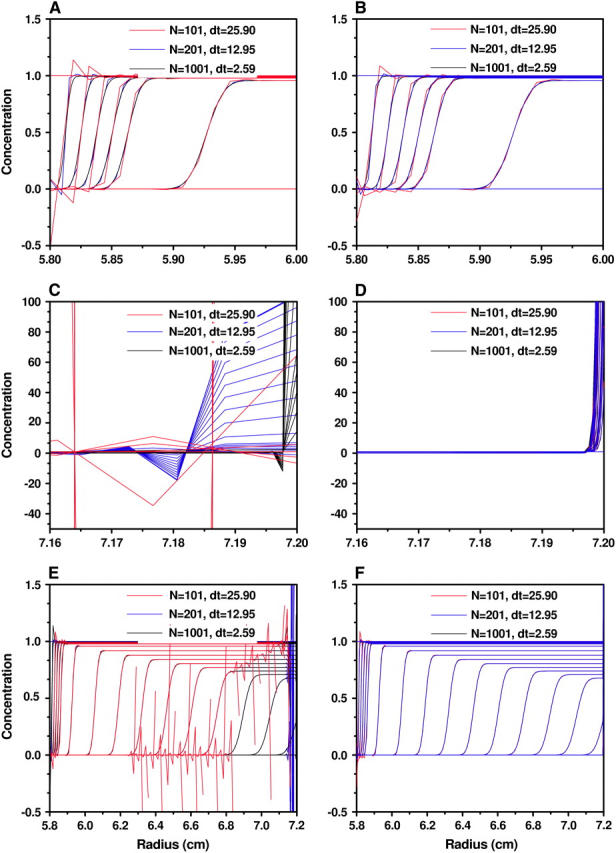
FIGURE 9.

Concentrations obtained by the moving hat method (A, C, and E) and the ASTFEM method (B, D, and F) with various N and δt for Example 2 (m = 5.8 cm, b = 7.2 cm, s = 1.562 × 10⁻¹², D = 1.279 × 10⁻⁷, 50,000 rpm, 6000 s). (A and B) The concentrations near the meniscus. (C and D) The concentrations near the bottom of the cell. (E and F) The concentrations on the entire cell.
