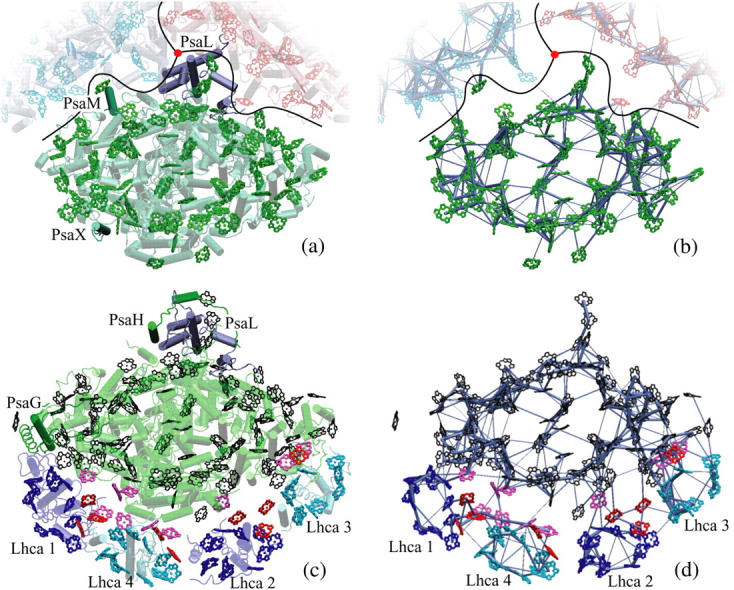
FIGURE 1.

Comparison of cyanobacterial and plant PSI structures and corresponding excitation transfer networks. (a) Top view of cyanobacterial PSI (5). The relative positions of two additional PSI monomers (in blue and red) in a trimer as well as the trimer axis (red disk) are indicated. Subunits PsaM and PsaX, which are unique to cyanobacteria, and the subunit PsaL, located near the trimer axis, are highlighted. (b) Excitation transfer pathways in the chlorophyll network of cyanobacterial PSI. The thickness of a bond between two pigments is proportional to log(t) + c, where c is a constant and t is the transfer rate between pigments. The highest of the forward and backward transfer rates is chosen. A lower cutoff of 0.22 ps−1 is introduced on transfer rates for displaying only the strongest connections. (c) Top view of the plant PSI-LHCI supercomplex (1,2). Subunits PsaG and PsaH, which are unique to plants, are highlighted, along with subunit PsaL. Lhca subunits and their associated chlorophylls are represented in blue (Lhca 1 and 2) and cyan (Lhca 3 and 4). (See Fig. 2 for the labeling of various chlorophyll groups for plant PSI.) Determination of chlorophyll orientations is explained in detail in Jolley et al. (2). (d) Excitation transfer pathways in the chlorophyll network of the plant PSI-LHCI supercomplex. The same cutoff as the one in b is used for comparison. The network shown corresponds to the model in column C of Table 1. (Figure made with VMD; see (77).)
