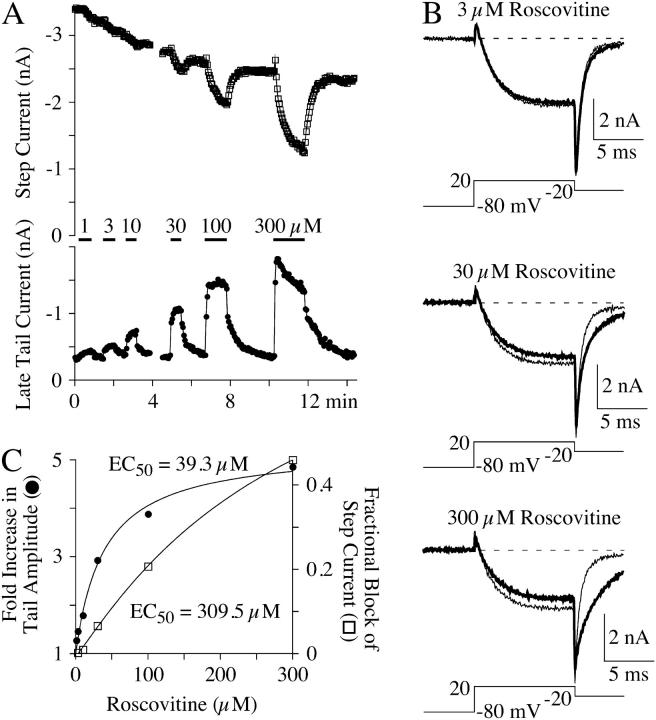
FIGURE 2.
Dose-response relationships for the roscovitine-induced slow deactivation and step current inhibition. (A) Step current (upper panel) and late tail currents (lower panel) show the inhibition and slowed deactivation effects of roscovitine, respectively. The currents were measured as described in Materials and Methods. Note the slow inhibition of the late tail current after the initial enhancement during 300-μM roscovitine. (B) Example currents from the time course shown in A. The control currents are from the step just before roscovitine application and the currents in roscovitine (thick traces) are shown just before switching back to the control solution, except for 300-μM roscovitine, which shows the current at peak enhancement of the late tail current (∼9 s into the roscovitine application). (C) The maximal late tail enhancement (solid circles) and step current inhibition (open squares) from the same cell shown in A and B are plotted versus roscovitine concentration. The smooth lines are fits using single-site binding isotherms to yield the indicated half-maximal concentration (EC50).

